The Struggles Of Australian Spin Bowlers In India
Arguably the most daunting challenge in modern test cricket, travelling to India is a tough ask for any team, regardless of their bowling line up. What makes India so tough revolves greatly around spin, not just how well they bowl but how equipped they are at facing it. Whilst India have always had several world class bowlers at their disposal at any one time, opposition teams tend to get sucked in to their game and select an extra one or two spinners each tour, which may not be as beneficial as some think.
There has been much conjecture about what type of squad opposition should be sent to India; should teams stick to what works for them or try and beat India with spin? With the highly anticipated series between India and Australia now underway, we are going to look at how Australian bowlers have fared in India in the past 40 years.
Australia results in India
Firstly, let’s take a look at Australia’s overall record in India:
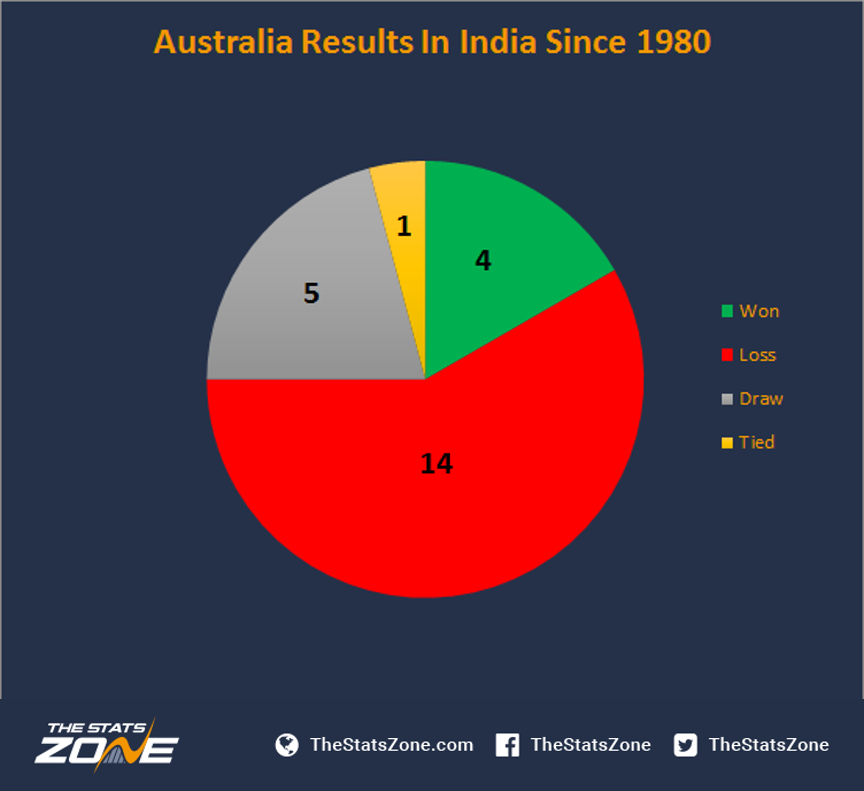
The above graphic shows just how much the Australians have struggled in India in recent times. With just four wins in the past 37 years, the tourists will be desperate to atone for past results.
Australian bowlers in India
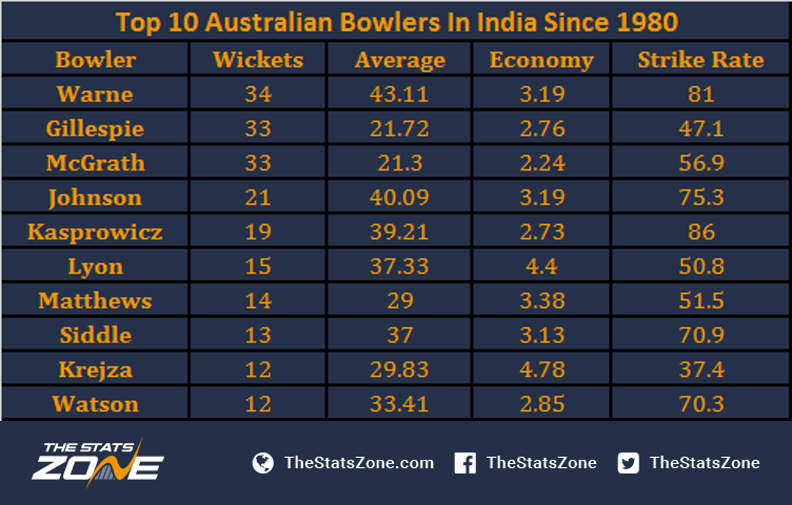
Taking a look at historical data for Australian bowlers in India since 1980 shows more dominance towards Australian fast bowlers. If we look at the top 10, Australian spinners have taken just 75 wickets, with Shane Warne claiming nearly half of those on his own (34), an alarming statistic considering the amount of spin bowlers that have been used in India over the years. In contrast, the majority of wickets taken by fast bowlers in the top 10 is spread over four players (McGrath, Gillespie, Johnson & Kasprowicz). It must also be noted that although Warne took the most Australian wickets overall, his average was also the highest of any bowler in the top 10 (43.11).
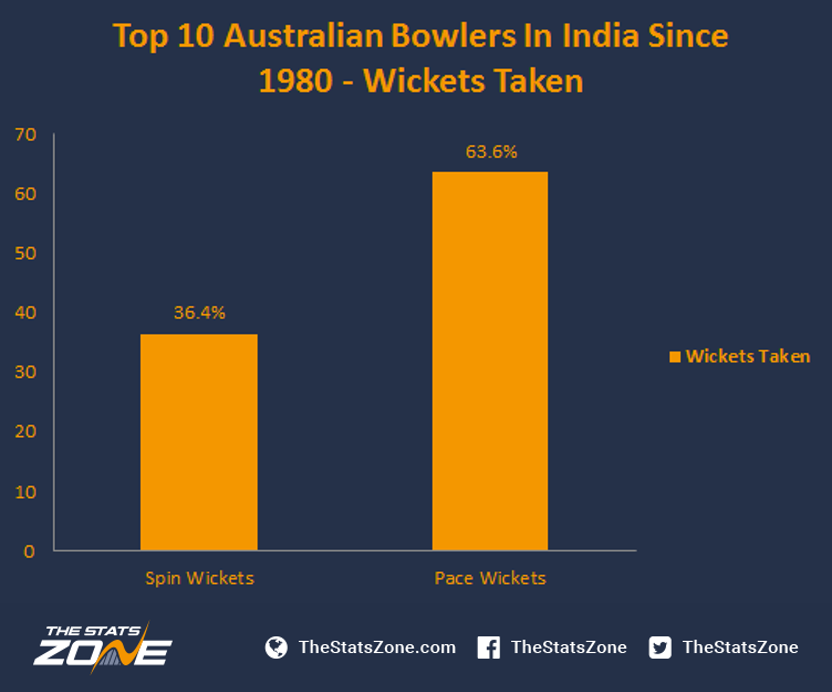
If we divide wickets taken by spin and pace bowlers, we can see that Australia’s pace bowlers have been far more successful, accounting for close to a third of Indian wickets taken since 1980 (top 10 bowlers):
Australian bowlers in Asia
To further analyse Australian bowlers in spinning conditions, we have also looked at data from all matches played by Australia in Asia since 1980:
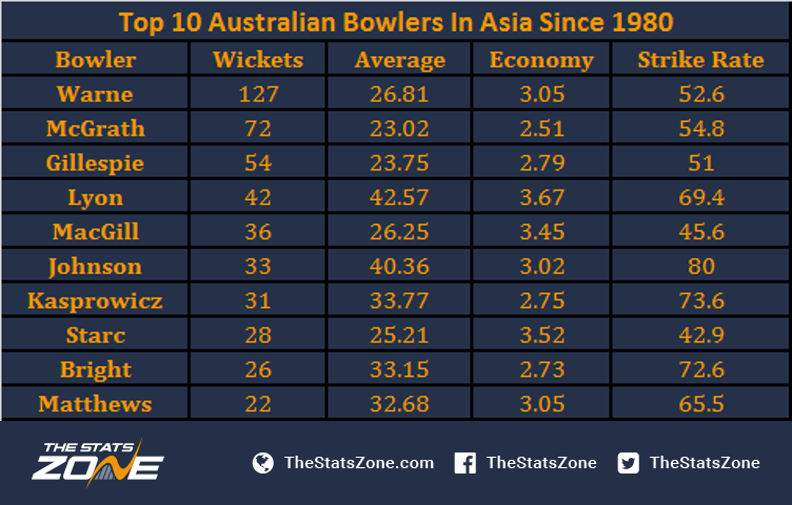
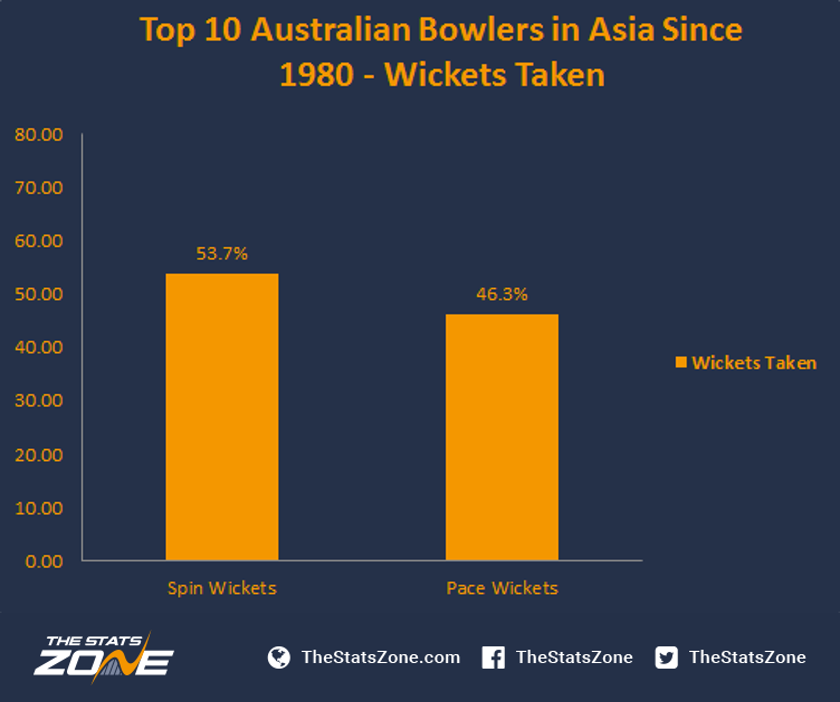
The historic data for Australian bowlers in all of Asia paints a vastly different picture to when Australia plays solely in India. The split is much more even between the number of spin/pace bowlers in the top 10 wicket takers since 1980 (five each), and a substantial turnaround with regards to the amount of total wickets taken by spin (231) and pace (218) bowlers. The vast difference in the number of wickets taken by the bowlers comes down to opposition; Australia’s spinners have taken a lot more wickets against lesser test cricketing nations such as Sri-Lanka and Pakistan. This is a testament to the Indian cricket team and the way they have always been able to dominate the opposition’s spin bowlers.
Indian Bowlers
To compare the two teams, we now look at India’s top bowlers at home against Australia since 1980:
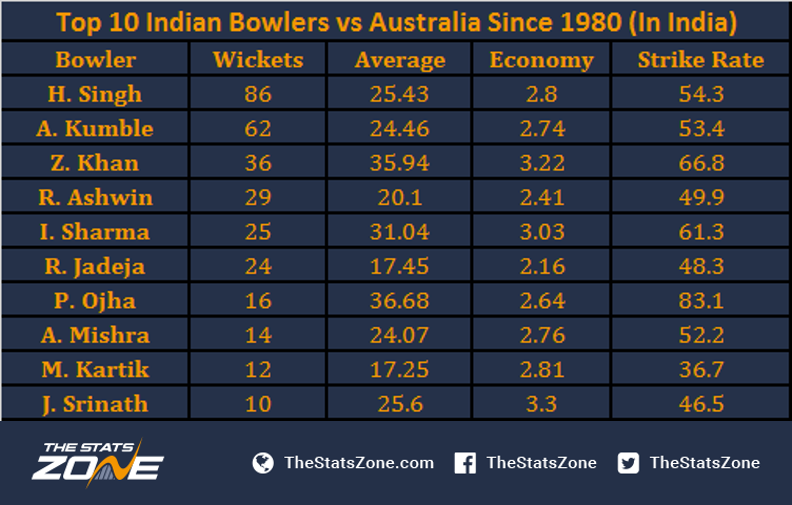
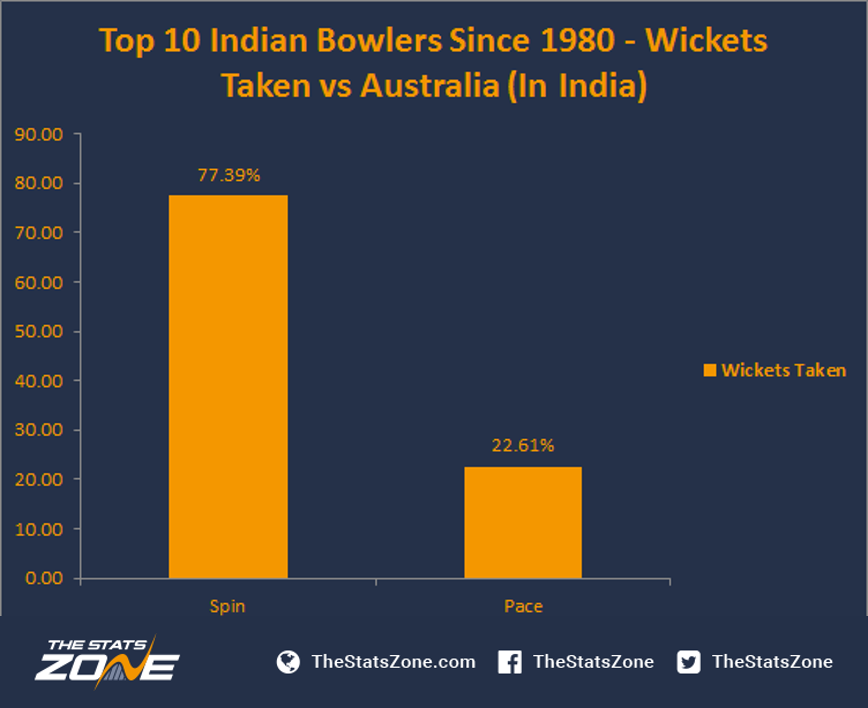
The results for Indian bowlers on their home turf against the Australian test side paints a clear picture – Australia have been completely exposed by spin when playing on Indian turf, with over 75% of wickets taken by spinners and just three pace bowlers appearing in the overall top ten.
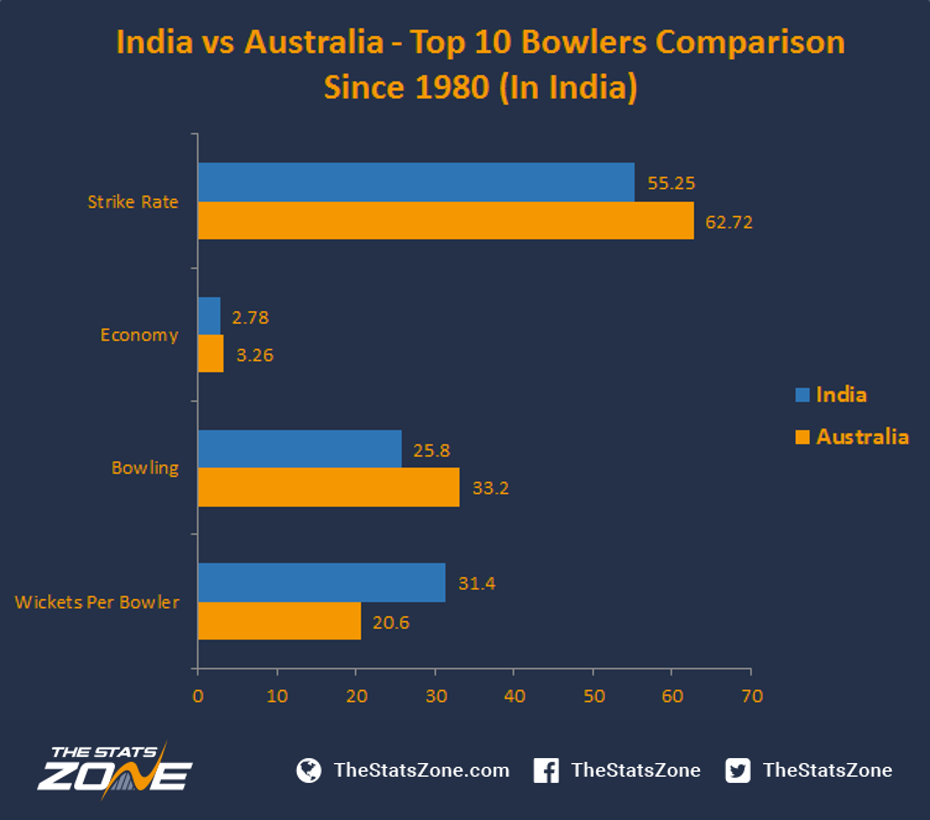
When looking at an overall comparison of bowling statistics for the two teams in India (top 10 bowlers on either side), it shows India’s clear dominance with the ball. From this, we can see that in general, India's top 10 bowlers take more wickets, take more wickets for fewer runs, and concede fewer runs per over when facing off against Australia.
Finally, we take a look at a direct comparison between Australia and India’s top 10 pace and spin bowlers:
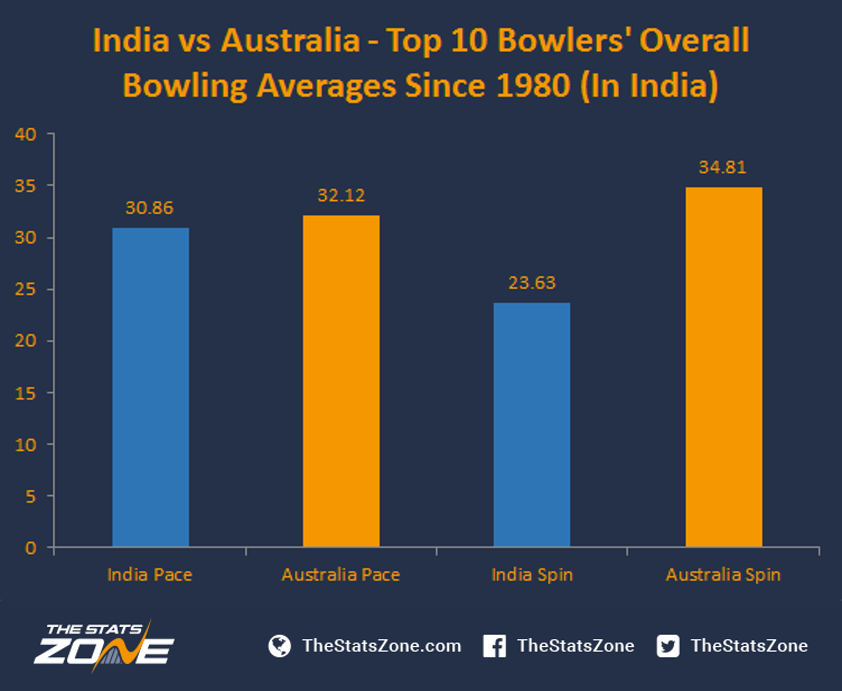
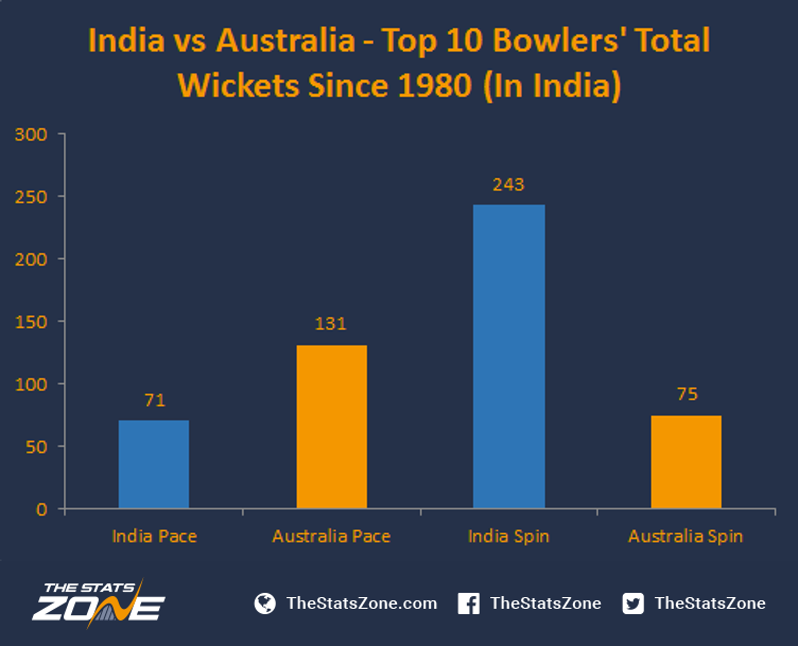
- Overall, India’s top 10 bowlers have been more successful than Australia’s, with both their pace and spin bowlers having the statistical advantage.
- India’s past and present spinners are elite, taking nearly half of the total wickets in both countries' top 10 lists in matches played since 1980, and boast an impressively low average of 23.63.
After looking through the stats, it is clear that both teams have different bowling strengths. India are clearly dominant with their arsenal of spin bowlers whilst Australia’s bowling strengths are with their pace bowlers. With these differences in bowling units and the expectation of dusty pitches throughout the summer, the series now underway should be a fascinating one.


