The Rugby Union ‘North South Divide’
The Rugby World Cup 2015 has been described by World Rugby as the most competitive tournament in the history of Rugby World Cups1. The gap in the playing abilities from tier 1 teams to tier 2 teams is closing. However, concern was raised about the dominance of Southern Hemisphere nations compared to their Northern counterparts. Is there really such a North – South Divide in Rugby Union?
There is overwhelming evidence showing that Southern hemisphere teams are more effective at scoring tries and that tries continue to win matches on more than 80% of occasions. Has this always been the case or are there periods when Northern hemisphere rugby has dominated the South?
The first step in unpacking these questions is a historical analysis of match outcome statistics; the number of points and tries teams scored per team per match for the Southern Hemisphere Rugby Championships (formally the Tri Nations) and the Northern Hemisphere 6 Nations (formally the 5 Nations).
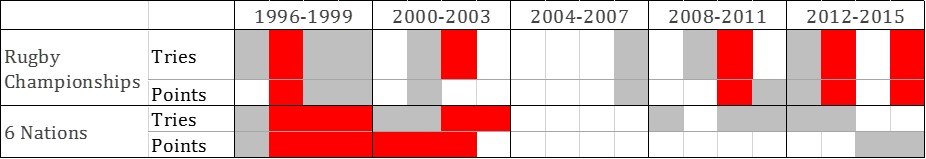
Note: Red denotes higher than average seasonal data. Grey denotes lower than average seasonal data.
6 Nations matches in the first 8 years of professional rugby recorded a greater number of points and tries per teams than have been seen over the last 8 years for the same competition. The Rugby Championships on the other hand seem to be scoring more tries and points on average currently than they did at the start of the professional era. At this point the indications are that Southern hemisphere rugby is becoming more try orientated than in previous years.
To determine the relevance of this suggestion a cross competition comparisons must be made. The first impressions support the evidence that Southern hemisphere nations score more tries than 6 Nations teams, however the influence this has on the overall points scored is a little less clear.
Certainly the period between 2001 and 2007 when all of the teams are scoring a comparable number of tries directly influences the number of points a team would score (with the exception of 2001). Interestingly England won the Northern hemisphere’s only World Cup during this period.
However, there are seasons in 6 Nations rugby specifically (1998, 2000, 2009, 2010, 2011 and 2015 for example) when the number of tries scored does not have a significant bearing on the final points scored by a team.
Historical Comparison of Tries and Points Scored per team per match for Rugby Championship and 6 Nation teams
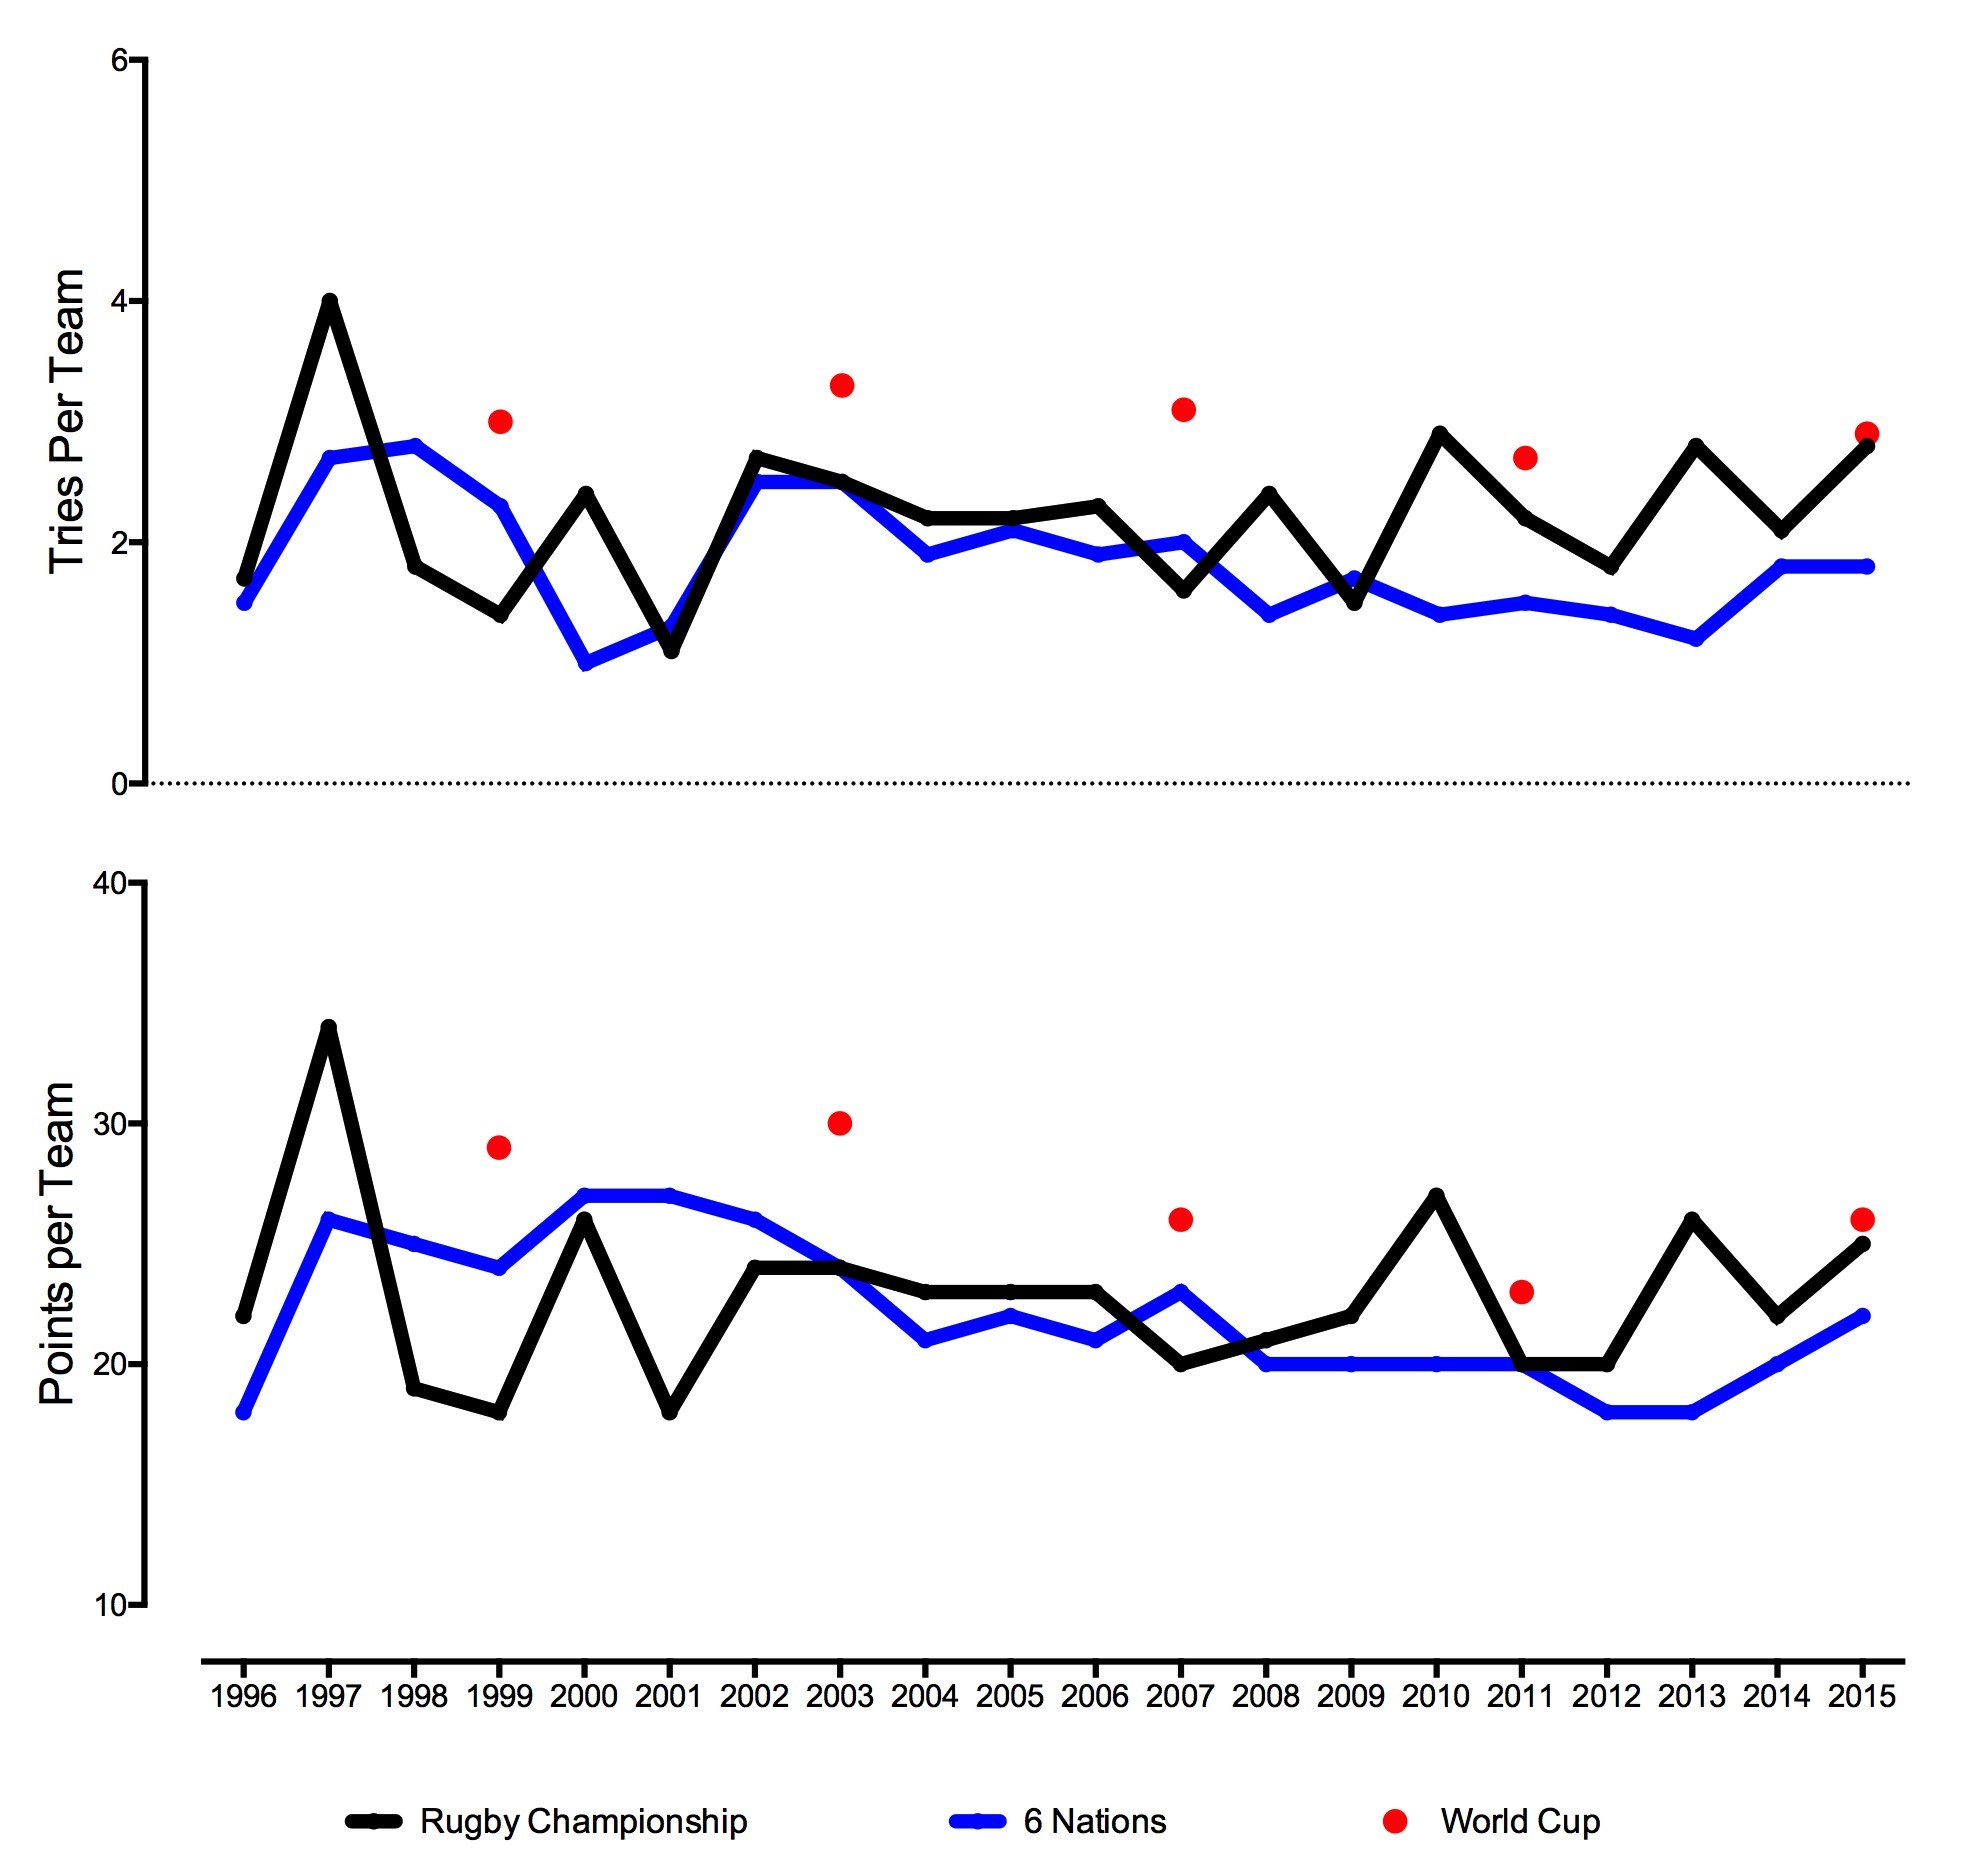
So how can these findings explain the success of the Southern hemisphere nations over their Northern hemisphere opponents?
Is it valid to suggest that these cross competition matches are weighted towards the Southern hemisphere nations simply as a result of how points are allocated to the different methods of scoring?
Or as we have seen from 2013 onwards that there is a resurgence in Northern hemisphere rugby, both in terms of points but more importantly tries?
Has the presence of 3 Australasian coaches and now with the introduction of Eddie Jones to England started to even out the balance of power?
Modelling Future Trends in Tries and Points scored by Rugby Championship and 6 Nation teams
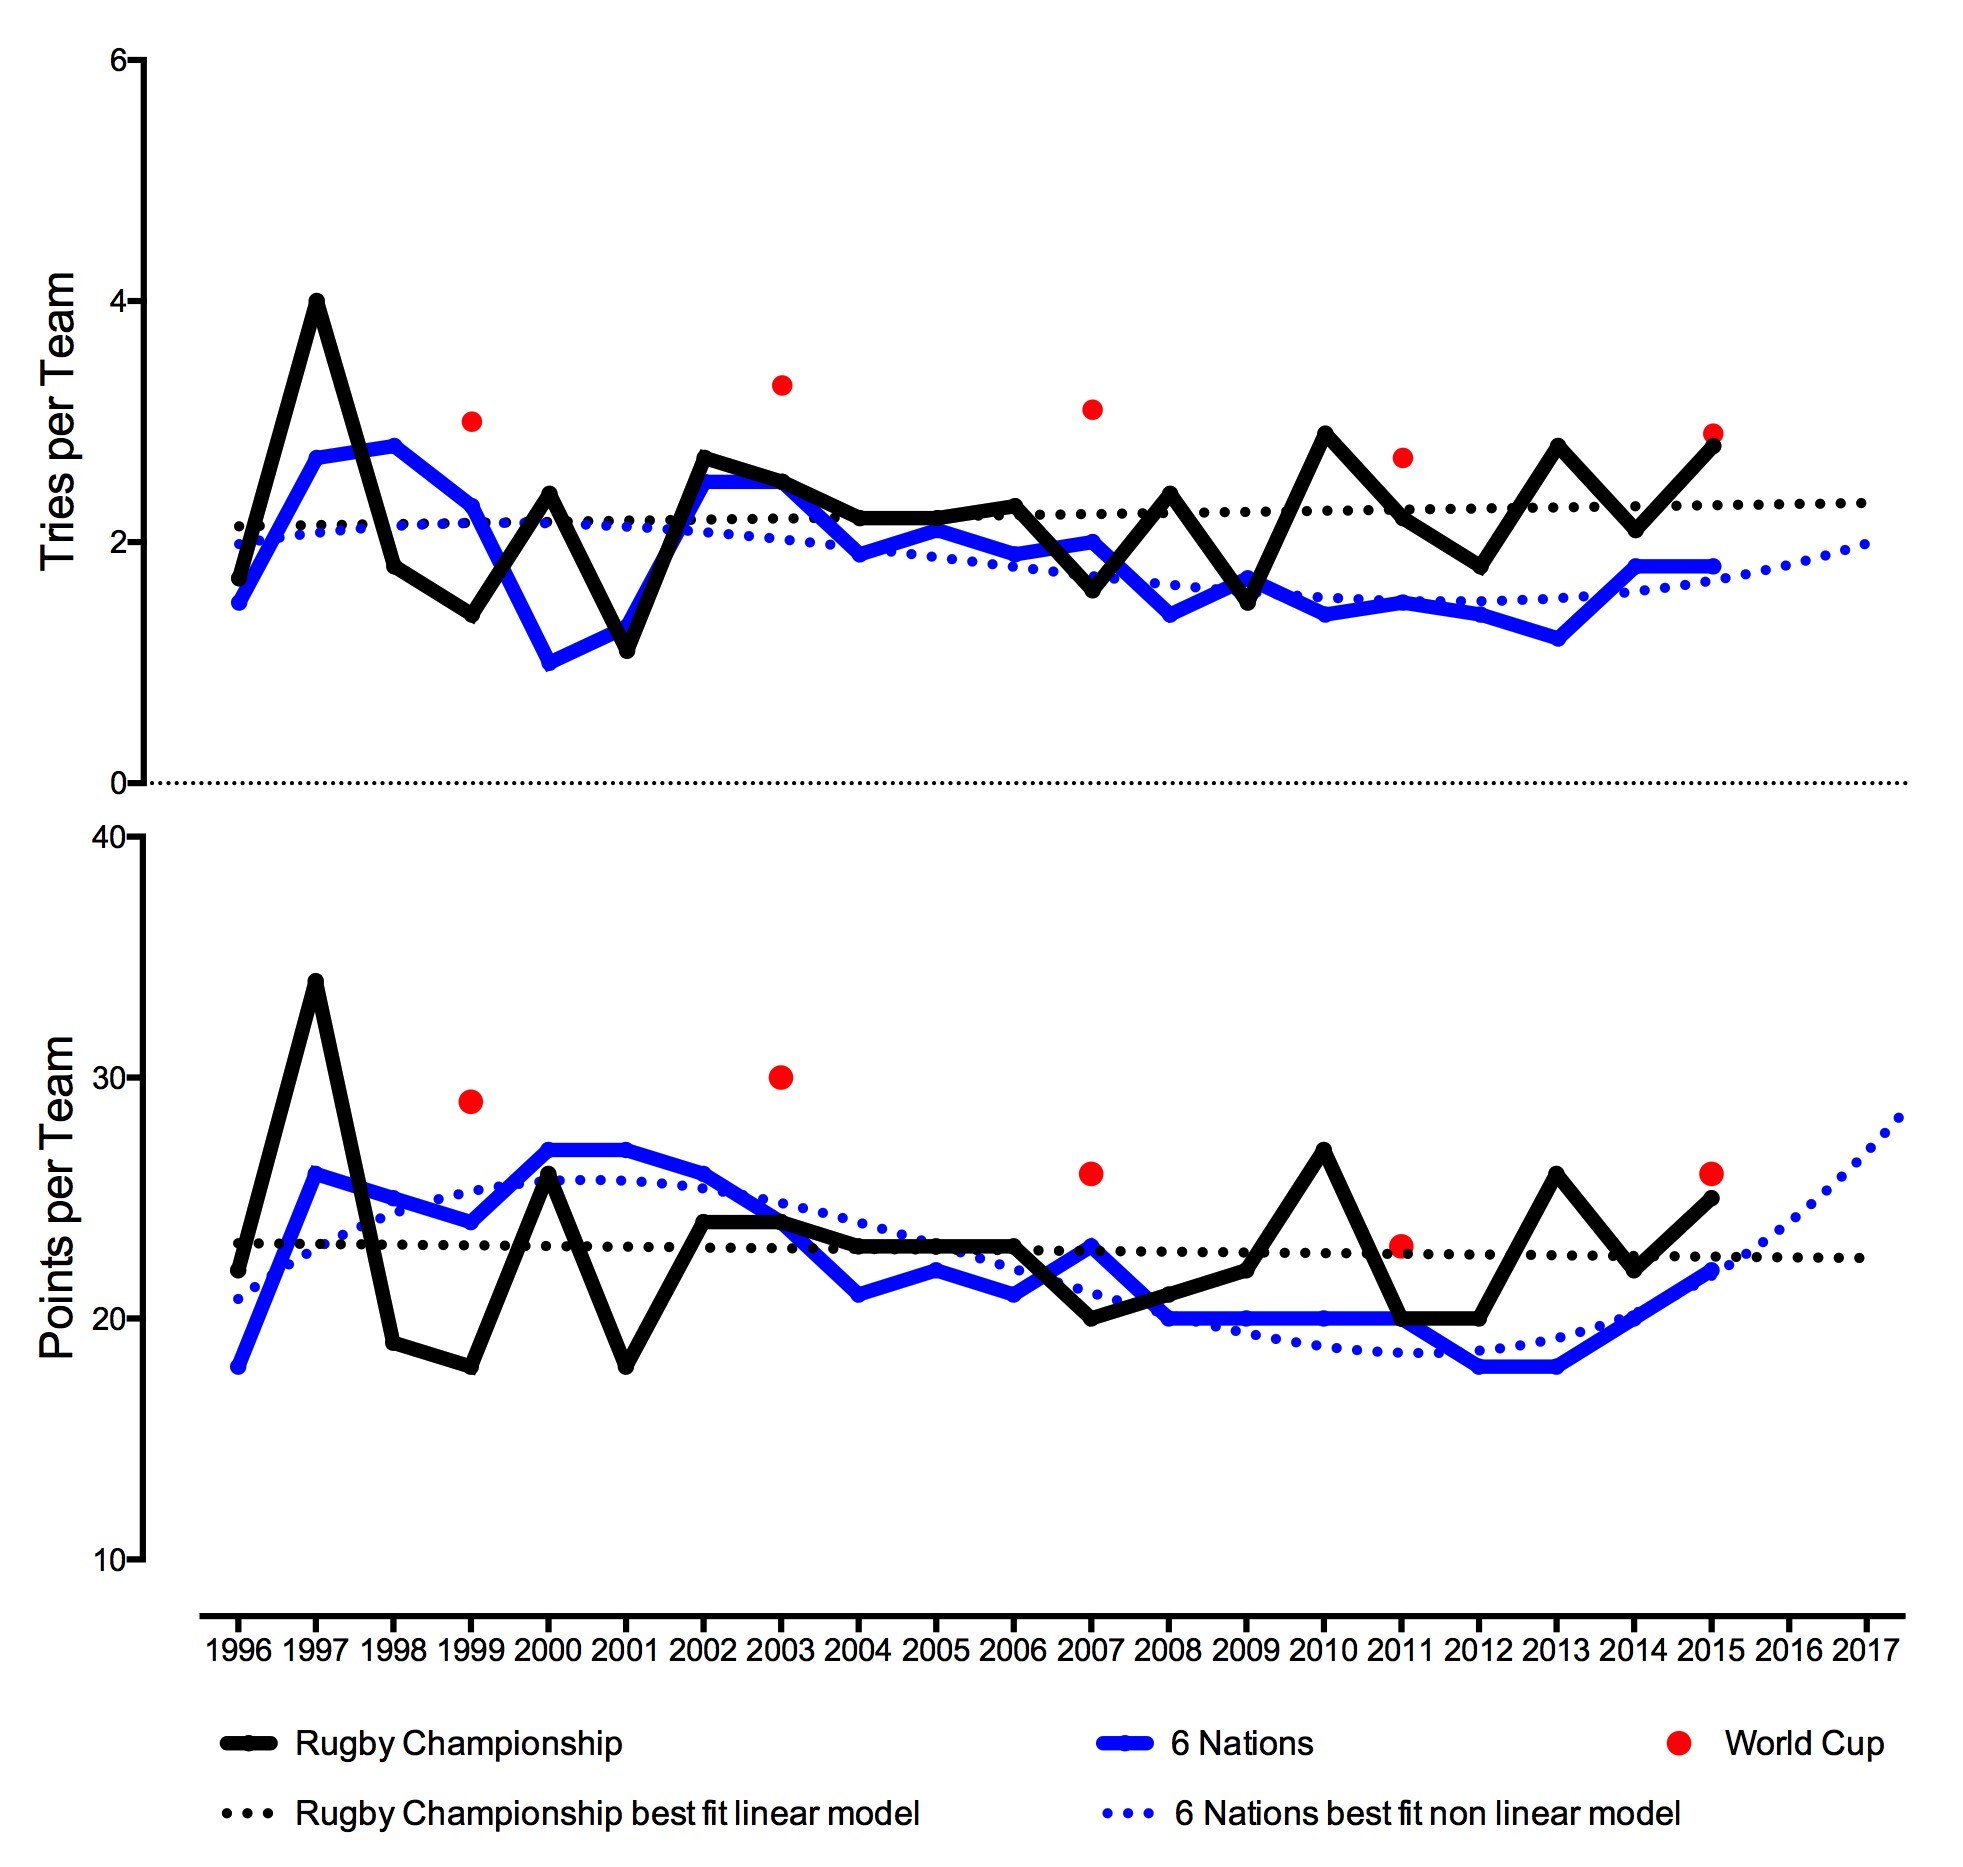
Whilst this article has raised more questions than it has answered, it is clear that currently there is a Southern hemisphere domination, but there are indications that tries and points scored are cyclic with both competitions experiencing highs and lows at different points in their histories. However, European rugby appears to be back on the rise with the points scored trending in an upward direction again and the tries per team appears to be stabilising. The next couple of years could be very interesting to watch and see if this model has any predictive value could produce more favourable results in cross-hemispheric matches.
References:
1 New report confirms most competitive Rugby World Cup http://www.rugbyworldcup.com/news/129277


