The Randomness of English Premier League Fixtures
The English Premier League is known as one of the most competitive football leagues on the planet, and one of the factors that influence this reputation is the mechanism of TV revenue distribution within the clubs, which is considered one of the fairest mechanisms within the top football leagues in the world. The mechanism distributes equally 50% of the funds among the 20 clubs, a share of 25% is distributed according to the final position, and the last 25% is spread according to the number of broadcasted matches. As the TV revenues are the main source of revenue for most of the EPL clubs (Manchester City and Manchester United were the only clubs in the 2014/2015 season where the main source of revenues originated from the commercial activities), the clubs are able to bring a high number of overseas top level players, increasing the competitiveness of the league, hence the uncertainty of outcome of the matches.
The EPL format is encompassed by 20 teams playing a total of 380 games (38 each club). However, even some matches are expected to be of a great importance, such as the stronger clubs playing against each other or even a local derby, there are other matches that do not seem to have such importance if analysing the fixtures at the beginning of the season. Though, over the season, these fixtures may become extremely important owing to the context of the clubs at the time these matches will be played.
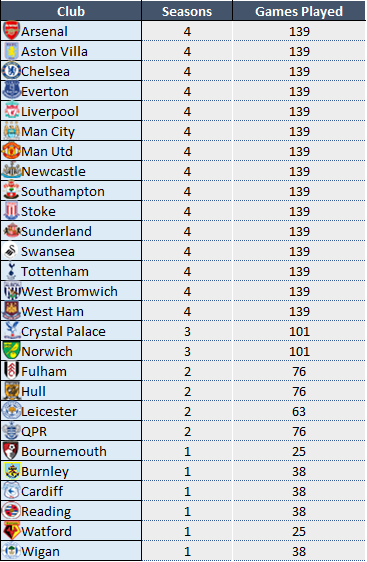
In order to understand the behaviour of the EPL clubs, an analysis was taken from the 2012/2013 season until the 25th round of the current edition of the EPL (2015/2016). The sample is encompassed by clubs which played all these seasons and also with clubs which have not finished a single season. The number of matches of each club is highlighted below:
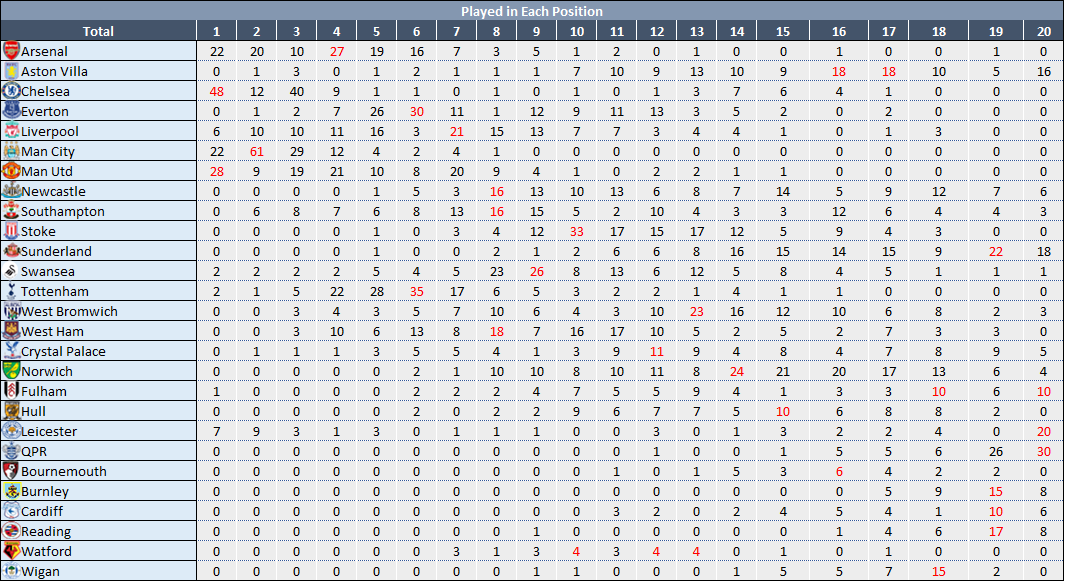
The context of the matches can vary according to on the position each club is placed in the league table, indicating that some clubs may have a harder path than others during the competition owing to the randomness of the fixtures draw for each season. The graph below shows that Manchester United and Chelsea played most of their games while they were at the top position of the table, followed by Manchester City and Arsenal which played most of their games while in the 2nd and 4th position respectively. On the other side of the table, most of the clubs which played most of their games within the relegation zone were relegated, as expected. However, there are a few exceptions of clubs which spend most of the rounds in the relegation zone and at the end of the season escaped from relegation, for instance, Sunderland and Leicester. This last spent last season fighting against relegation and has begun an extraordinary recovery since the 31st round of the last season which lasts until the current season, where the club has been doing an extraordinary campaign

Looking at the position which clubs played most of their games, Chelsea and Manchester City are the clubs which were more often in the first three positions, while Arsenal and Tottenham figured the fight for the last spot in the UEFA Champions League.
At the middle table zone, the most frequent clubs there are: Liverpool, Swansea, Stoke City, West Ham and West Bromwich. Apart from Stoke City at the 10th position, all other positions in the middle table had a smaller frequency than the top positions of the table, indicating a higher level of competition at this zone. Similarly, the bottom table shows also a high level of competition due to its low frequency, with Norwich placed frequently in the link between middle table and the relegation zone. In the last positions, QPR is the club with the higher frequency in the two last positions, which resulted in two relegations over two seasons of the sample.
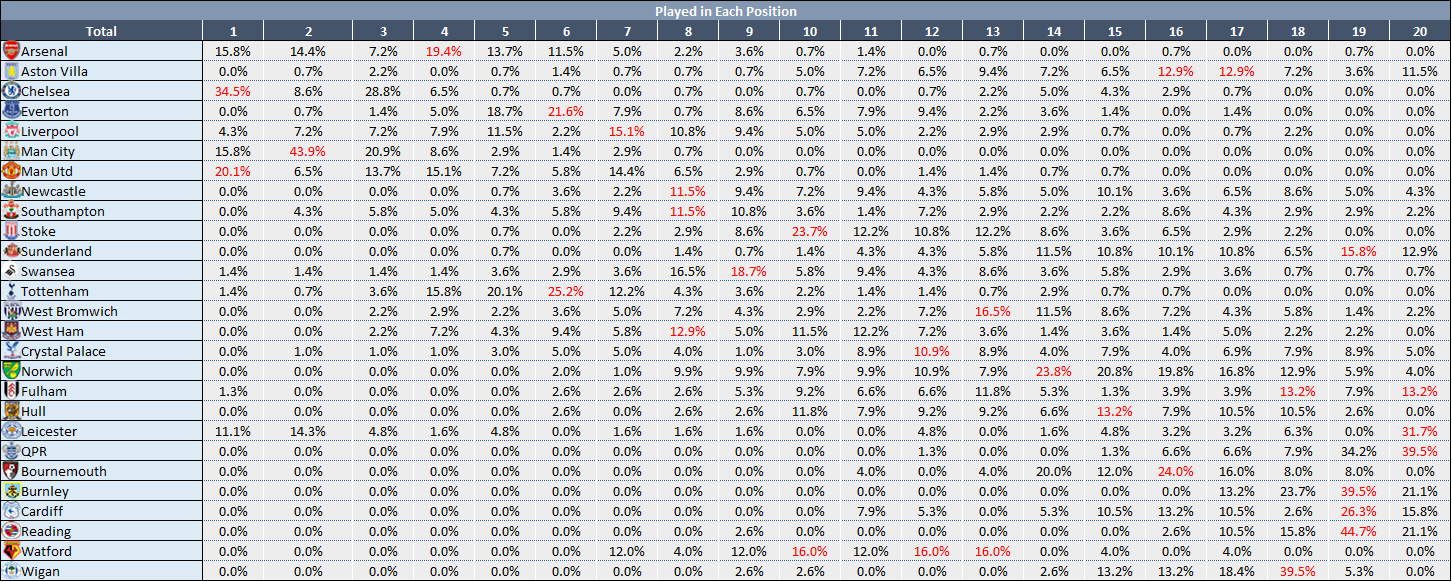
Nonetheless, the sample does not have the same number of games played to all teams. Thus, looking at the proportion of games played, there are a few changes on the figure mentioned above. Whilst the top table and middle table show a similar figure, the bottom table suffered a few changes with Bournemouth, Wigan and Reading appearing more frequently in the bottom positions of the table in relation to their number of games played.
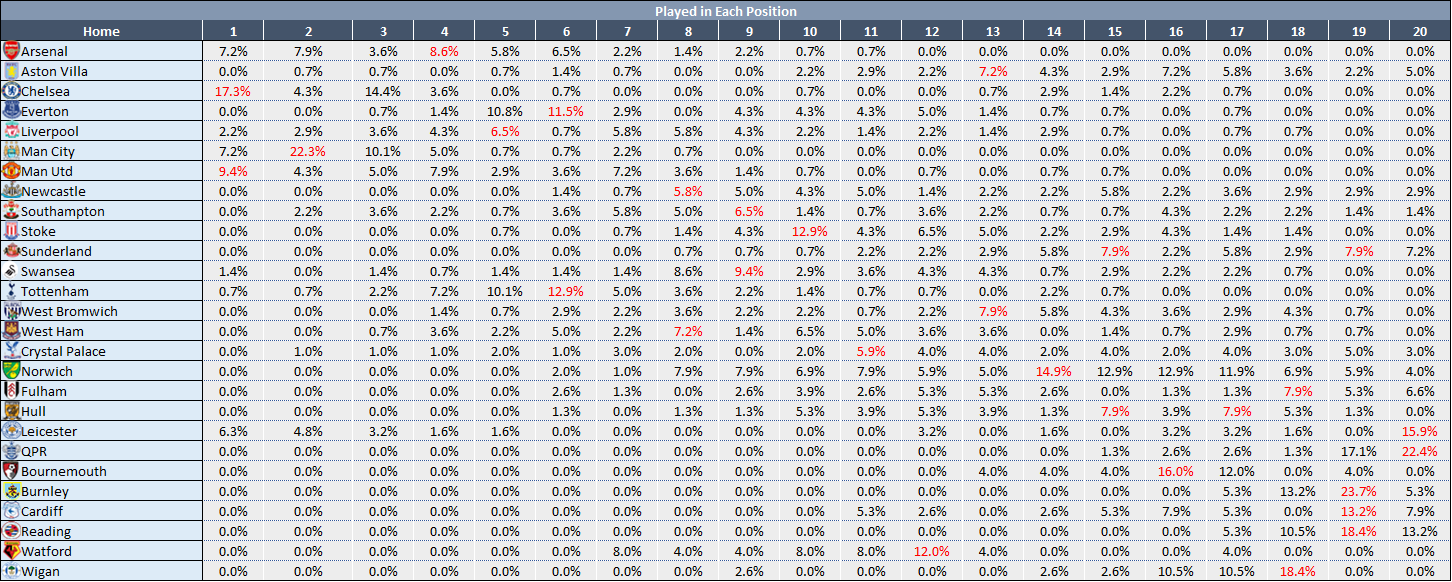
Considering that playing at home provides an advantage and playing away a disadvantage, a deeper analysis of these figures does not show a significant change when looking at the most frequent position of each club when playing at home or away, particularly by the fact that hardly a club go up or down significantly on the table in a single round. Thus, substantial changes on table positions for a club may come after a sequence of successful or unsuccessful results in a few rounds and not in a single round.
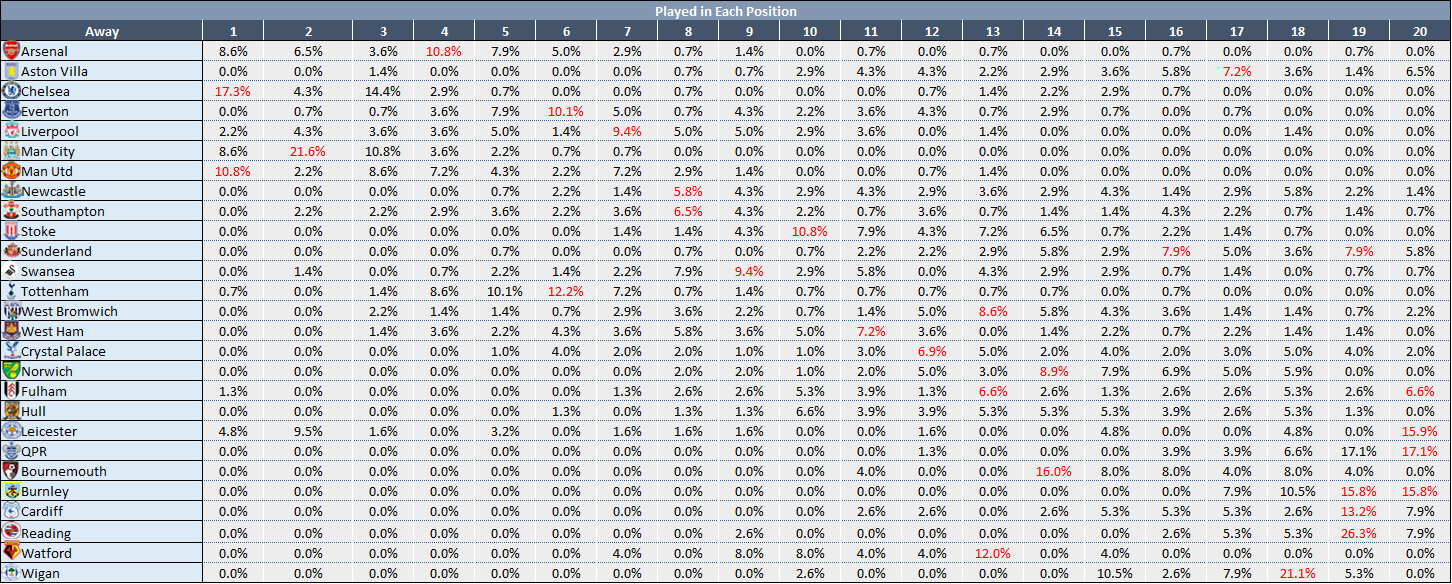
Looking at these tables, it can be seen that the clubs usually are constantly placed at one of the three zones of the league table. Hence, to identify which clubs belongs to each table zone, an analysis of the percentage of rounds that clubs are mostly placed in the three zones of the table was taken to identify the clubs composing the clusters.
The first cluster is composed of clubs that usually are fighting for a top table position, which are the title, a UEFA Champions league qualification and even a Europa League qualification. The second is composed of clubs which are usually on the middle table, where could be fighting for a UCL qualification, Europa League spot or even against relegation. The last is composed of clubs which are usually fighting against relegation and eventually for a middle table position at the bottom half table of the competition. However, Leicester has a particular aspect on this definition. As cited previously, the last and the current campaigns of the club are from a rare aspect in the Premier League. The last time a club was placed in the last position in a year and in the first position a year later was at the Christmas of 1988, when the leader Norwich was placed at the last position a year before. In addition, as the current competition has not finished, the team still has more games at the bottom zone of the sample, thus the reason the club is placed with the bottom league zone clubs even having a higher frequency than the Middle Table cluster teams at the top positions of the league.
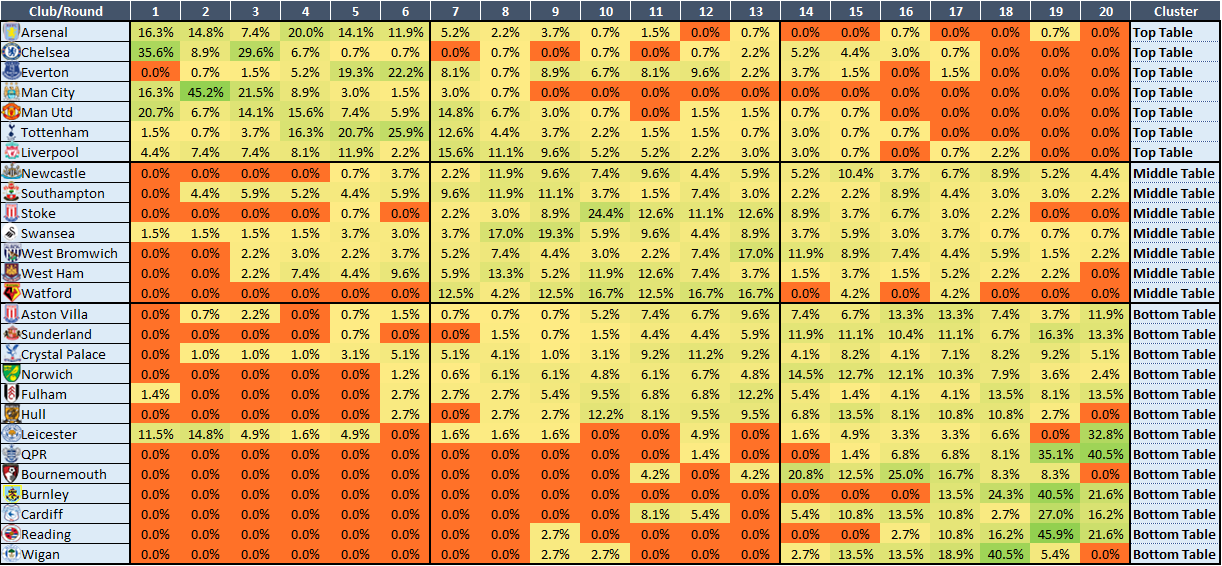
With the level of competitors defined and their frequency on the league table zones identified, the analysis has a clearer view to identifying which clubs can be considered luckier than others on the randomness of the league fixtures. Thus, an analysis was taken on the opponent’s position in the context of each played match

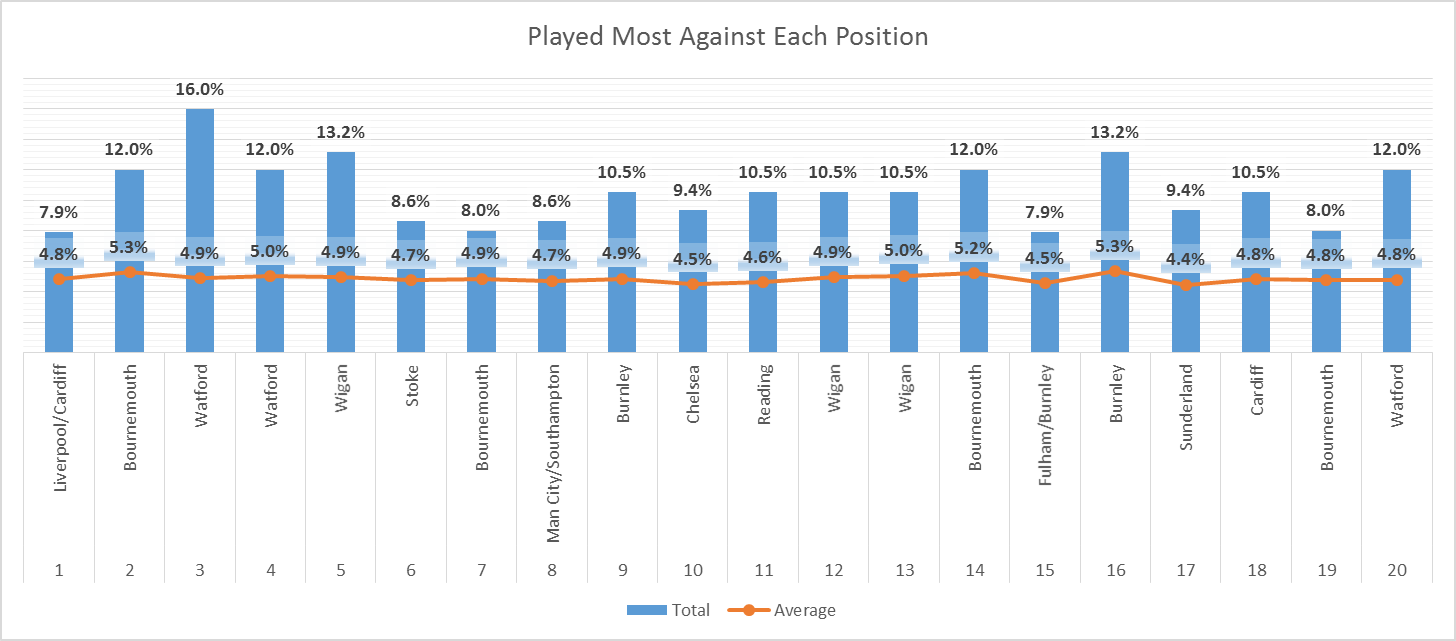
Looking at the higher frequency of the highest position of the opponents that each club played, the Top Table cluster teams had different insights:
Liverpool (1) is the most unlucky club from the whole sample, playing most of their games against the 1st position. Also, Arsenal (3) was unlucky by playing mostly against a top table club. Curiously, none of these clubs won the league.
Manchester United (12) was the luckiest club of the cluster by playing most of their games against the 12th position. Also, the club won only one title in the sample.
Comparing to Arsenal and Liverpool, the remaining clubs of the cluster can also be considered fortunate owing to all of them played with more frequency against clubs from the middle table zone. Chelsea (10) and Manchester City (8) won a title in this period.
Analysing the Middle Table cluster, the randomness of the fixtures demonstrates that:
Stoke City (6), West Ham (3), and Watford (3) were the unluckiest clubs of the cluster because they played most of their games against clubs from a top table position.
Swansea (15) and Crystal Palace (16) were the luckiest clubs by playing against the clubs from a bottom table position.
The remaining clubs, Newcastle (13), Southampton (8), and West Bromwich (12) played most of their games against clubs also from the middle table zone. Resulting in a more competitive schedule for these clubs.
The figures from the clubs from the Bottom Table cluster indicates that:
Most of the clubs in this cluster were unlucky and played most of their games against clubs from the top table. The unluckiest clubs were Leicester (2) and Bournemouth (2). None of them were relegated, Bournemouth is playing for the first time in the current season and Leicester escaped from relegation in the last season. The other clubs are Cardiff (3), Fulham (4), and Wigan (5). However, none of them escaped from relegation. The last, Aston Villa (6), has been fighting against relegation since the first season of the sample.
The luckiest clubs of this cluster are those which played most of their games against clubs from the same cluster. Even being very competitive, the clubs from this cluster are still the weakest oppositions. From these clubs, only Sunderland (17) escaped from relegation in all seasons from the sample, while the others, Norwich (17), Burnley (16) and Hull City (20), seemed to not have enjoyed the advantage, particularly the last, which is the luckiest club of the sample
The last two clubs, Reading (11) and QPR (13) played more games against middle table teams. Nevertheless, none of them could escape from relegation.
In a different approach, applying the same analysis on the proportion of games played of each club shows that Cardiff also played most of their games against the 1st position. Also, Watford that has been doing a good campaign this season has played most of their games against the 3rd and 4th position, and at the same time against the last position of the table. On the other hand, Wigan played most of their matches against the 12th and 13th position and was relegated. Also, the remaining clubs from the Bottom Table cluster played mostly against clubs from the same cluster as well.
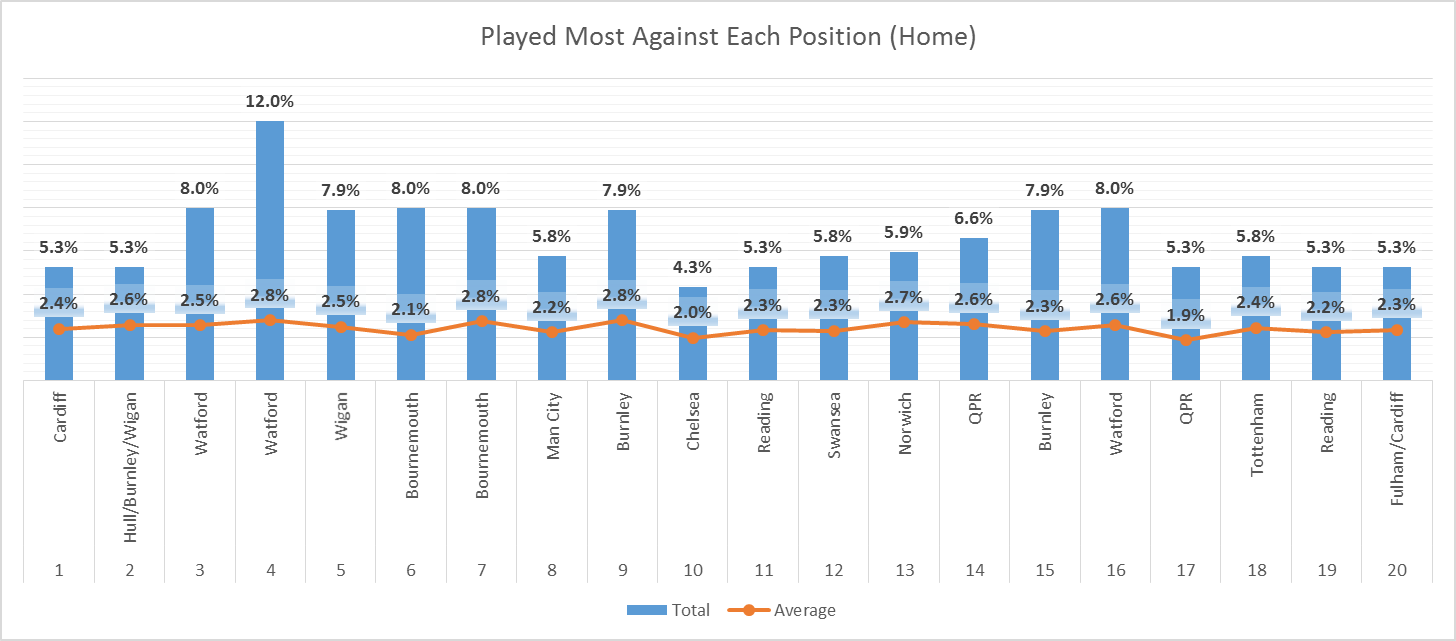
Looking only at the home games, Fulham and Cardiff were the clubs which proportionally played most of their games against the last position, followed by Reading, which played mostly against the 19th position. Also, from the Bottom Table cluster, QPR and Burnley were the clubs which played relatively more home games against others bottom table positions. Nevertheless, all these clubs were relegated. In addition, from the clubs which played most of their home games against a bottom table club, Tottenham can be considered the luckiest club by being the club which played mostly against the 18th position at home. On the other hand, at the top table, most of the clubs which proportionally played most home games in these positions are clubs from Bottom Table cluster as well.
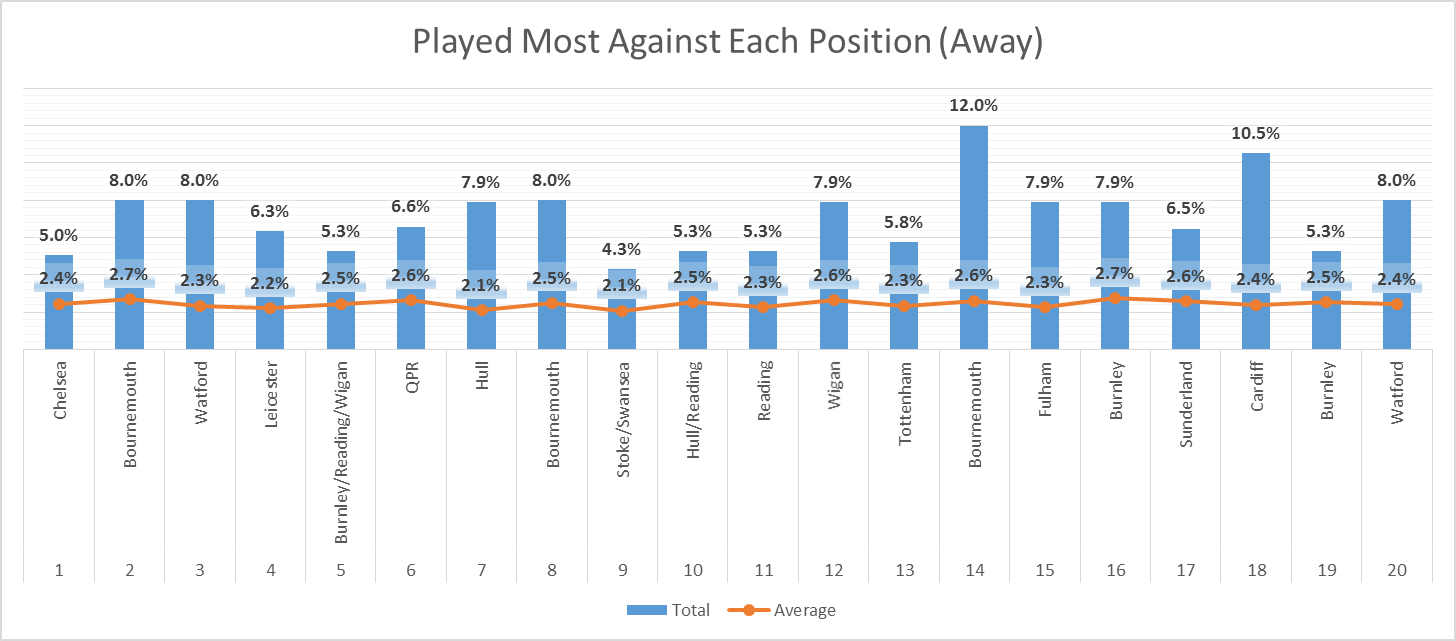
The clubs which proportionally played most away games against clubs in the bottom positions are also clubs which were relegated or are currently fighting against relegation, with the exception of Watford, providing them a disadvantage by playing away against clubs which also are fighting against relegation. Curiously, Chelsea, which is the club which that had more games played when placed at the first position, also played proportionally most away games against the first place.
The randomness of the league fixtures is caused by the constant changes of positions during the competition. It is very common that the league table changes after each round and it rarely remains unchanged. In order to analyse these table changes, an analysis was taken in the league table movements round by round. The analysis demonstrates that the clubs which mostly moved up in the table in the sample are the recently promoted Watford and Bournemouth, followed by Tottenham and Crystal Palace, with all of them with more than 30% of the rounds going up. On the other hand, QPR which made two seasons without significant progress at the bottom of the table had the worst ratio of table progress, followed by two clubs which appeared constantly within the top 3 positions in the sample, Chelsea and Manchester City, which obviously had less clubs to take the position at the top of the table.
The clubs which mostly moved down are from the middle table or bottom table cluster. From the top table cluster, Everton is the club which had most moved down with 30.2% of the times. On the other hand, the frequent top table placed clubs, Chelsea and Manchester City had the smallest ratio, followed by Leicester, which spent most of the last season in the last position and at the current season have not moved down frequently.
Looking at the most constant clubs, the clubs from the top and bottom clusters are the most constant clubs in the league table owing to the top clubs frequently win more and the bottom clubs frequently lose more, maintaining these clubs at the same positions over several rounds.

One context that frequently changes positions in the league table and also has a huge importance for both clubs that are playing the match is the “6 points” game, which is a match between clubs with 3 or less points of difference, which a victory not only provides three points to the winner, but also does not provide any points to the opponent, increasing the chances of finishing in front of the direct competitor to the winning team.
In order to analyse which club took more advantage by playing a game against a direct competitor, the analysis demonstrates that Hull City (21.1%) was the club which proportionally played most home games against direct competitors. However, the club won only 43.8% of times. On the other hand, QPR, Reading and Wigan (10.5% all of them) had the least home matches played against direct competitors. Also, looking at the away matches, Stoke City (21.6%) had more “6 points” matches, while Chelsea (6.5%) had the least number of matches against competitors with 3 or less points of difference.
The club which most enjoyed the advantage by winning more games at home against direct competitors is Manchester City with 73.3% of times, followed by Chelsea with 70.6%. Also, the club which won proportionally most games playing away against direct competitors was Watford, by winning half of the games. Nonetheless, in general, the club which proportionally won most of the matches against direct competitors was Chelsea by winning 57.7% of times followed by Manchester City with 56.3% of the times. On the other hand, Reading did not win a single game against direct competitors, which results in the club with most losses in these games by losing 80% of them

These figures indicate that a club with more success in these games is more likely to be more successful at the final table. So, in order to analyse this importance, a strong negative correlation (-0.797) was found between the percentage of achieved points in those games and the average final position on the league table. However, the clubs which played for only one season could affect the sample due to some of them played only a few games and a single result provides a significant percentage which affects the real result. Hence, taking a sample only with clubs that played at least two seasons resulted in an even stronger negative correlation (-0.897), and a following correlation analysis with clubs that played at least three seasons showed an even stronger negative correlation (-0.919). These negative correlations analysis means that the higher percentage of points won in the “6 points” game, the higher the chances the club has to finish in the top positions of the league.
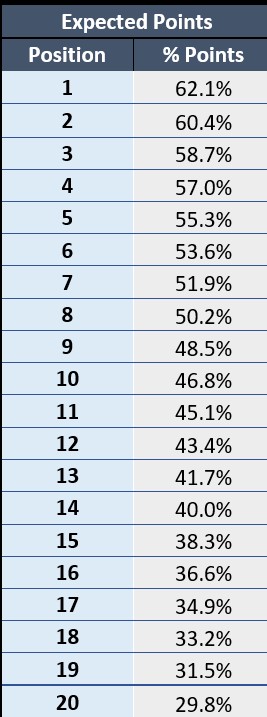
In order to measure the percentage of points a club is likely to achieve in a “6 points” game to finish in a particular position in the league, a linear regression was taken with the cubs which played at least three seasons and the result not only showed a strong correlation as cited previously, but also a strong coefficient of determination (R2=0.8056). The result indicates that usually the club which finishes at the first position is likely to achieve 62.1% of points on these matches, whilst the clubs which finish in the last position are likely to achieve only 29.8% of these points

To conclude, these analyses show that some clubs are fortunate to play more often against rivals in a worst table position and vice-versa. However, it was not found any influence of this randomness on the final result on the league table. Conversely, achieving significant results in games played against direct competitors has a strong influence on the final position of a club in the league table. Indicating that these games are more usually more vital than other games in a different context.
Also, the analyses indicated that Chelsea and Manchester City were more constant in the top positions; The bottom of the table showed to be the most competitive zone of the table by having more change of positions, followed by the middle table and then the top table; A club hardly changes position significantly in a single round (apart for the beginning of the season), concluding that a club must have a constant campaign to improve or drop positions on the league table; and last, Liverpool is the most unlucky club of the sample by playing most games against the leader, while Hull City was the luckiest club by playing most games against the last position of the league table.


