The Globalisation of European Football
The impact of globalisation has penetrated every aspect of modern day society and the European football stage is no exception. Week in week out, across every league, we see players from all corners of the globe competing at the highest levels of club football.
Over the years there has been some concern expressed by British experts, managers and journalists that this phenomenon may interfere with the development of domestic players. In fact, it has been heralded as one of the main factors behind why the English national team have struggled to perform in the World Cup and the European Championships. On the flip side, we find teams such as Spain, Germany and Portugal who have seen success in the aforementioned tournaments. But is their proportion of native players significantly different to the English league?
TSZ has decided to dive into European club football data to see if there are any patterns between foreign and native players. Are some leagues on the brink of losing their own (national) identity? Are any leagues being taken over by specific countries? And what nationalities really seem to perform best? Let’s see what the stats have to say…
There were a few considerations in this study. Firstly, we have decided to look specifically at the following six leagues: English Premier League, French Ligue 1, German Bundesliga, Italian Serie A, Portuguese Primeira Liga and Spanish La Liga. Secondly, the study includes data for the last season (2015/16) and all available data from the current season (as of 27th September). The data only includes games played in the domestic league to enable a league-to-league comparison. As European Football contains players from over 100 nationalities, we have decided to pick the five most represented (in terms of highest proportion of minutes played) for each of the investigated leagues, and allocate the remainder of countries to an additional category called “Other”.
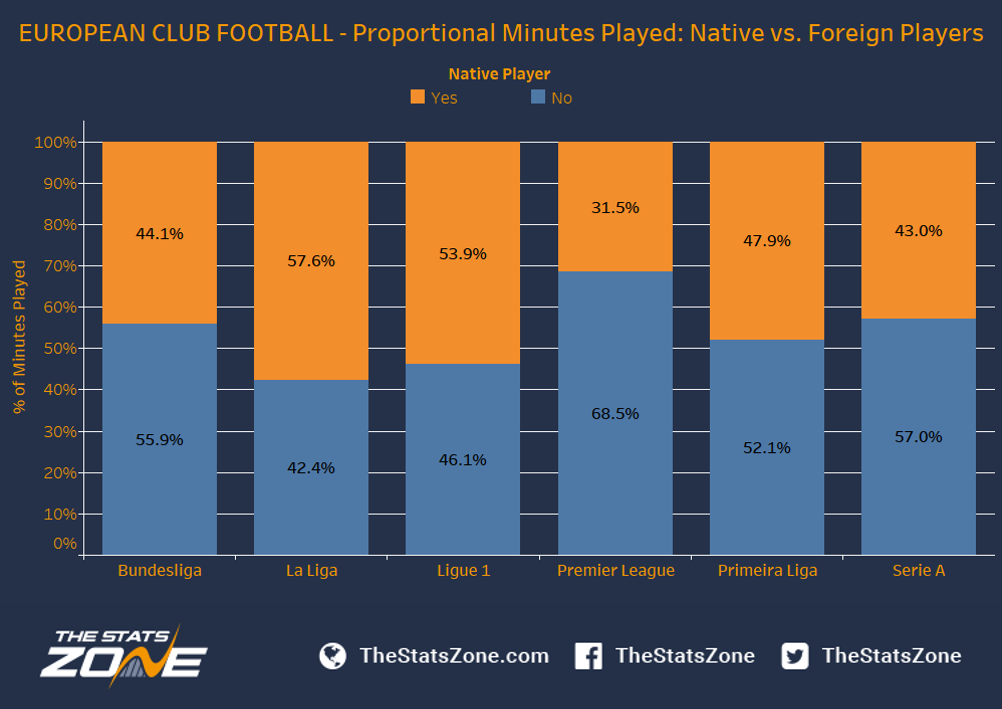
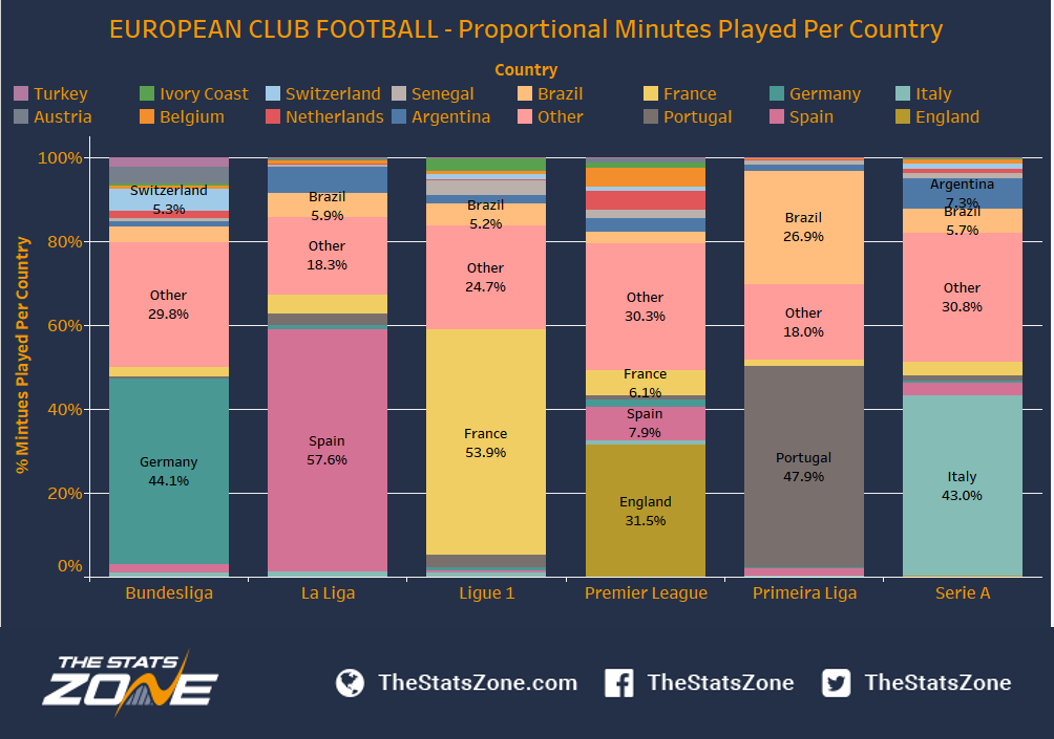
The analysis is divided into two sections. In the first section, the top graph looks at the proportion of minutes played for native and foreign players split by league. This will be visualised in a stacked bar graph as it helps us understand proportions between the two groups. The numbers within each bar show the exact proportion for each respective league. The second graph follows the same structure, but investigates the proportion of minutes played, this time split by continent. The final graph in this section splits the percentage of minutes played per country and league. Again, this is visualised in a stacked bar graph where the key numbers for each country can be found within the bars.
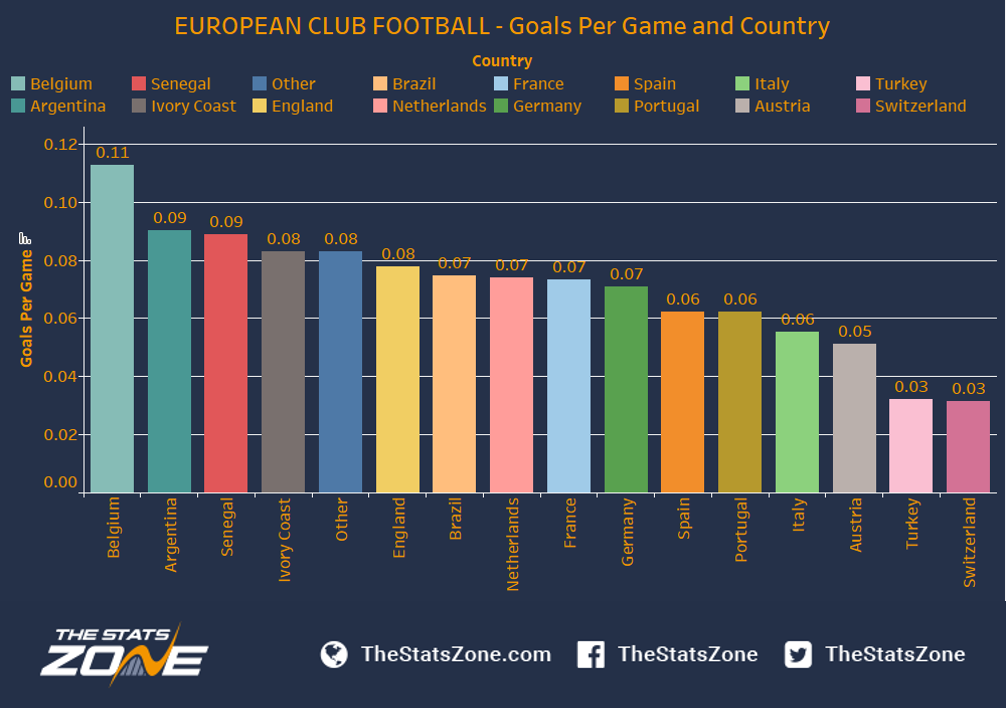
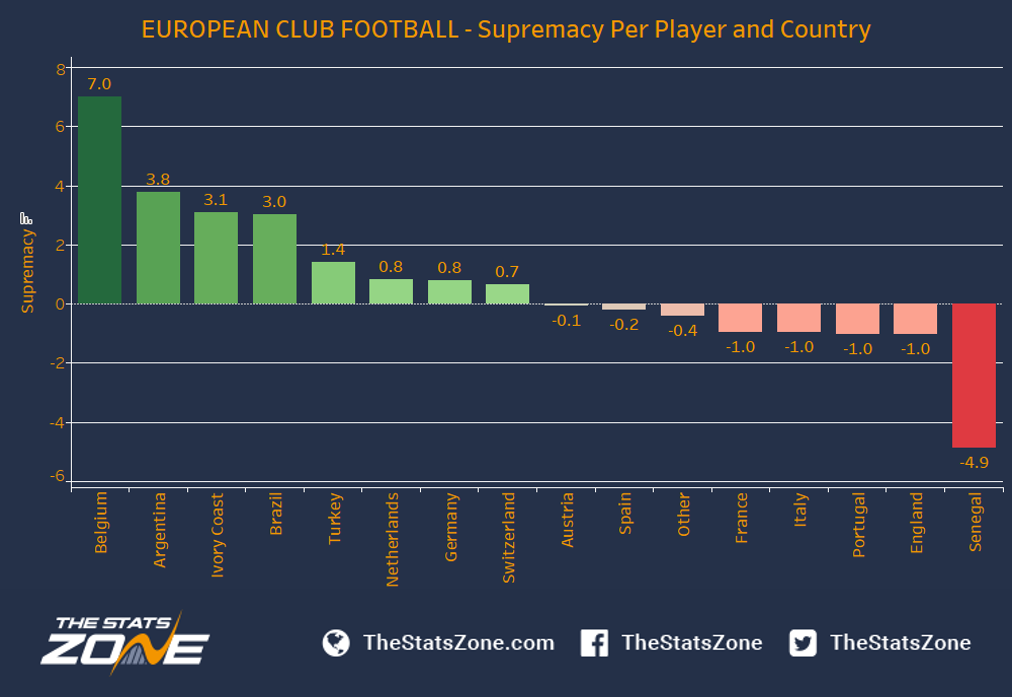
The second part of the analysis starts by looking at the average number of goals per player and country in the data set. This is visualised with a bar graph with the actual average statistics for each country on top of each bar. The second graph follows the same structure but looks at the average number of goals per game for each country. The third and last graph considers the simple principle of success in football - the number of goals scored in comparison to the number of goals conceded. We have named this “Supremacy”, and this is calculated as follows:
Supremacy = Goals For - Goals Against
So to get into the analysis, in the first graph we can see the variation in the proportion of minutes played by native vs. foreign players in different domestic leagues. La Liga has the highest percentage of minutes in the league played by native players, topping the list at 57.6% of all minutes. Ligue 1 closely follows them at 53.9%. Notably, these are the only two leagues in the data set that have a 50% or more representation on the pitch by local talent. A closer look at the Premier League shows a more pessimistic story, with a total of 31.5% of the minutes on the pitch being represented by English players. These figures may explain the concern held by some in the British football community (as outlined in the introduction) that perhaps English teams don’t give local players as much time on the pitch as the other comparative domestic leagues.

Moving on to the second graph, it is clear that all leagues have a clear majority of European players. The highest majority is the Premier League in which European players represent a total of 79.3% of all minutes played. Bundesliga closely follows this at 79.1%. African players seem to play a crucial part in Ligue 1 with 22.1% of all minutes played, sitting well ahead of the other leagues for this continent’s representation. This could well be explained by the fact that several African countries also speak French as their mother tongue, hence facilitating acclimatisation. Interestingly, if we look at the Primeira Liga in Portugal there is a heavy representation of South American players: they delivered almost 1/3 of all minutes on the pitch in the league. Again, the common language between these locations, which is something we will investigate further in the next graph, could confidently explain this. Before moving forwards, it is worth pointing out that there seems to be a strong relationship between Asia and the Bundesliga, with 5.9% of all the minutes coming from this continent.

Moving onto the last graph in the first section of the analysis, we look at the proportion of minutes played per country in each league. The clearest observation from this graph is that for each league, the domestic players have the highest proportion of minutes played. In fact, it is only in the Premier League in which this is closely contested by players in the “other” group. However, this graph also enables us to identify any correlations between specific countries outside of domestic players.
The strongest correlation is within the Primeira Liga, where Brazilians played 26.9% of all minutes. This supports our theory from the last graph that players speaking the same language tend to seek leagues in which acclimatisation is easier. Similarly, in Bundesliga we can see that the proportion of minutes played by Swiss players is higher than in any other league in the data set at 5.3%. Again, this could be linked to the common German language spoken in these countries.
As a side note, it is interesting to point out that outside of their domestic leagues, the French and Spanish have a higher representation in the Premier League than in other leagues. Aside from the obvious fact that travel between these countries is quick and easy – we also know that the Premier League is seen as financially stronger, hence attracting international players.

Moving into the second section of the analysis, the next graph illustrates the number of goals per player in European club football, split by country (for the whole period of the study). Here, we can see that France and Senegal top the list with an impressive number of 2.9 goals per player. For France to have this score of goals per player is impressive when we consider the proportion of players in the data set who are French, which is also very high. Before moving onto the next graph, we want to point out that out of the other six leagues investigated, German players scored on average 1.5 goals per player, followed by Spanish and English at 1.4.

To break this down further, the next graph looks at goals per game split by country. There is a clear correlation with the graph above in that countries sit roughly in the same positions in relation to one another. One country that has moved significantly is Belgium, rising to the top of the graph with 0.11 goals per game. This comes as no surprise with most of the players in the “golden generation” figuring and performing well in the top European football competitions. Senegal are also worthy of mention, scoring well across both graphs with an average goals per game of 0.09; a closer look into their national team shows that most of their players figure in the other leagues that we have investigated. For example, Sadio Mané has been an integral player in Liverpool’s positive start to the 2016/17 season.

The final graph looks at average supremacy per country, which as we described in the introduction relates to the number of goals scored minus the number of goals conceded. We can see that Belgium outperform all others in the study with a supremacy score per player and country of 7.0. The closest chasing team is Argentina, trailing by 3.2 goals at 3.8. Senegal’s stats tell a sad story compared to the previous two goal-scoring related graphs, where they were at the top of the field. Notably, here they find themselves at the very bottom with a supremacy score of -4.9, significantly less than any other country. Specifically looking at the leagues analysed in this study, we can see that only the Bundesliga (Germany) has a positive supremacy. England, Portugal, France and Italy all sit with a negative supremacy of -1.0.

In conclusion, we have looked at the data around the representation of different nationalities in six European football leagues. Interestingly, the Premier League has the least minutes played by native players. On the flip side, the highest number of minutes on the pitch delivered by domestic players (>50%) is from Spain and France. When we looked even closer into the data, we identified that France have a strong link with Africa, and that Portugal have an even stronger link with South America and Brazil. This is most likely explained by commonality in cultural factors, most obviously language, which nourish the number of minutes played by those nationalities in a game.
When looking at goal scoring per country, it is clear that France and Senegal were the leading countries in the study. This is most impressive for France when we consider the proportion of players in European football of this nationality. Moving on to goals per game it’s clear that Belgium are performing particularly well. Additionally, their supremacy score, which is higher than any other country, supports this.
One interesting side note on this study was a dive into the number of minutes represented for nationalities outside their own league. Here we found that English players only account for <0.5% minutes played in any of the leagues. Whilst it is hard to say that the reason behind poor international performance comes from a lack of diversity in English players who have not experienced other leagues, we can certainly see that the countries who perform well at an international level seem to have the common denominator of a high proportion of minutes played internationally.


