The Decline Of The Norwegian National Team
When talking about Norwegian football it is hard not to relate back to their national football legends Ole Gunnar Solskjaer, Henning Berg and the infamous Flo brothers. All of these names form part of the pinnacle of Norwegian football, in a time that could be identified as a “Golden Generation”.
Who can forget the World Cup in 1998 when Norway beat a Brazil side full of recognised international players? It was a win that meant everything to a nation crazy about their football which also saw them qualify for the next stage in the tournament.
In recent years, the Norwegian team’s performance doesn’t provide such an inspirational tale. They have failed to qualify for all major international football tournaments since the European Championship in 2000. They also haven’t done themselves any favours in the current World Cup qualifier with two lost games in the first three, making it cumbersome for them to qualify from this position. Their manager Per Mathias Høgmo’s inability to galvanise the team has been the most commonly discussed reason for their current performance, but Høgmo only took charge of the team back in 2013 and here at TSZ we feel like the downward trend in Norwegian football performance started prior to this point.
With this in mind, we have decided to dive deep into the data around the Norwegian national team and investigated their performance over the years. Where and when have the set-backs taken place? Was the success in 1998 simply down to a golden generation or how else could recent performances be explained? Where on the pitch has the Norwegian team changed, is it mostly in the attacking or defensive department? Are the players this year playing in less influential clubs than in the aforementioned golden years? Let’s see what the stats say…
There are a few considerations in this study. Firstly, we are looking at all fixtures played (friendly games included) by the Norwegian national team between 1990 and 2016 (up to and including the 11th October). Secondly, the data for the FIFA world ranking only stretches as far back as 1993. In this data set we have decided to use October’s ranking for each year and compare how this changes year-on-year. In the last part of the study we are looking at the proportion of players in that are participating in the Champions League and Europa League at club level. Since the European competitions have changed slightly over the years we have decided to group what previously was called the UEFA Cup and UEFA Cup Winners Cup as Europa League.
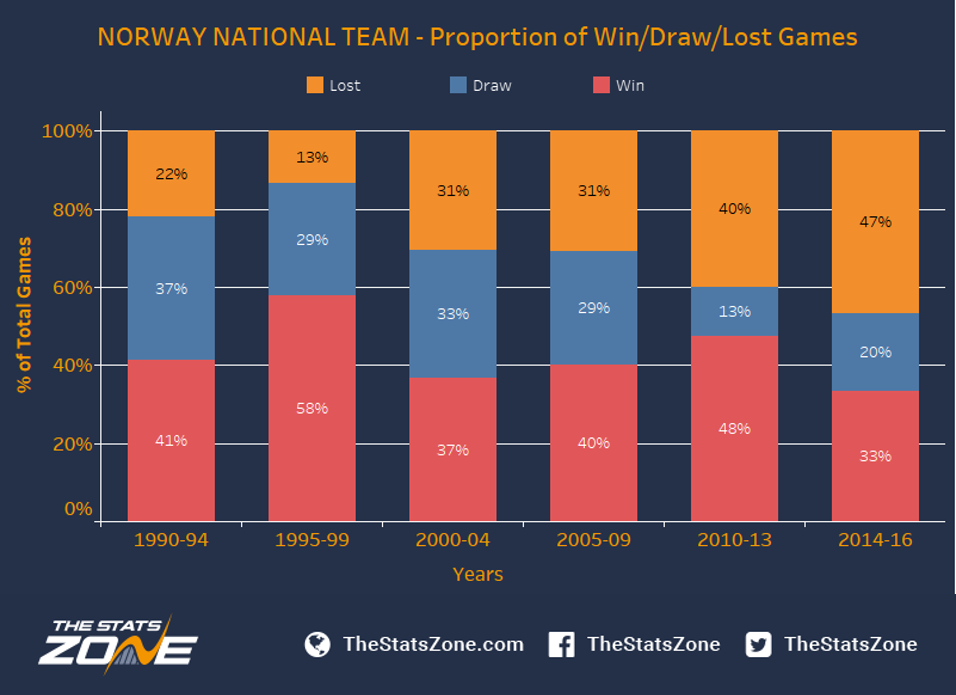
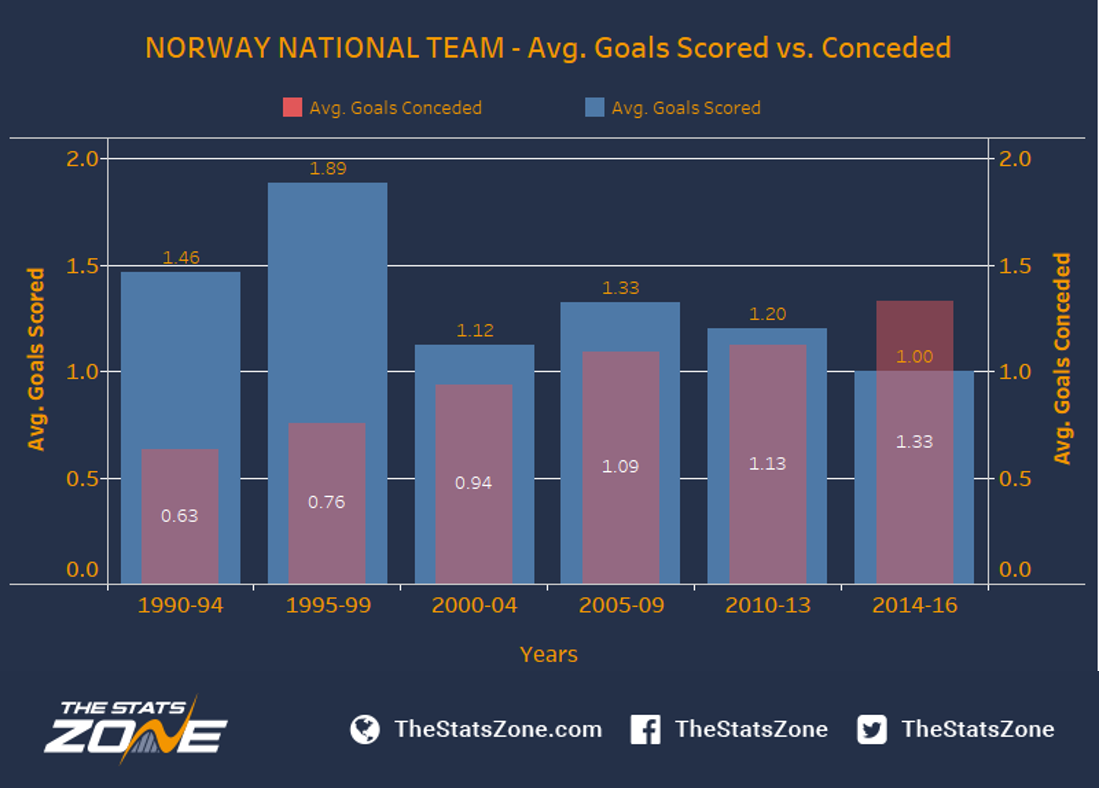
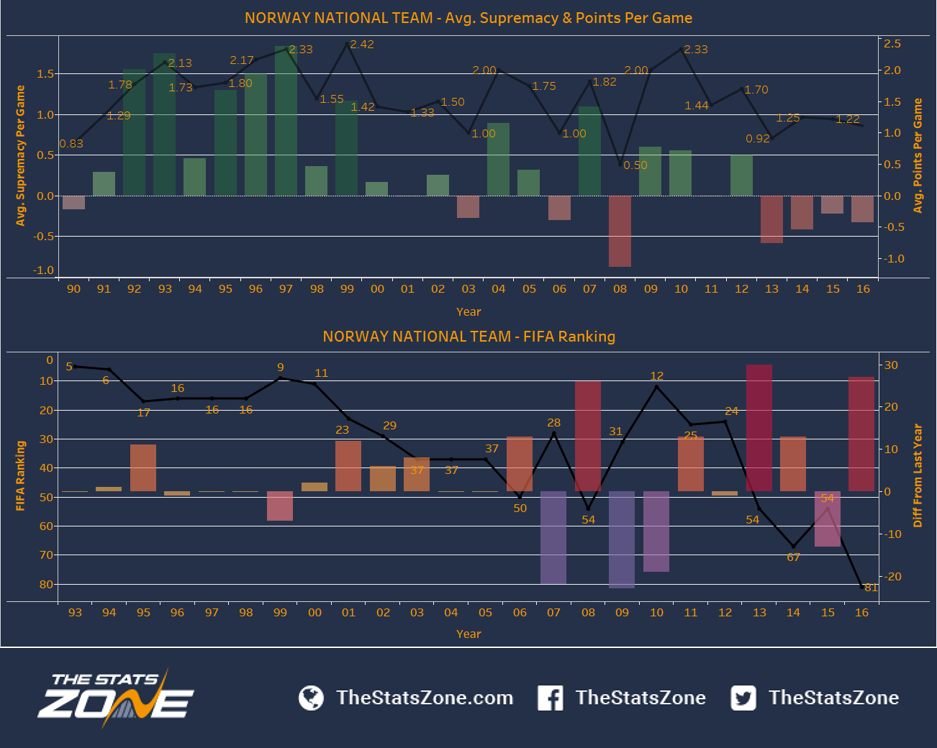
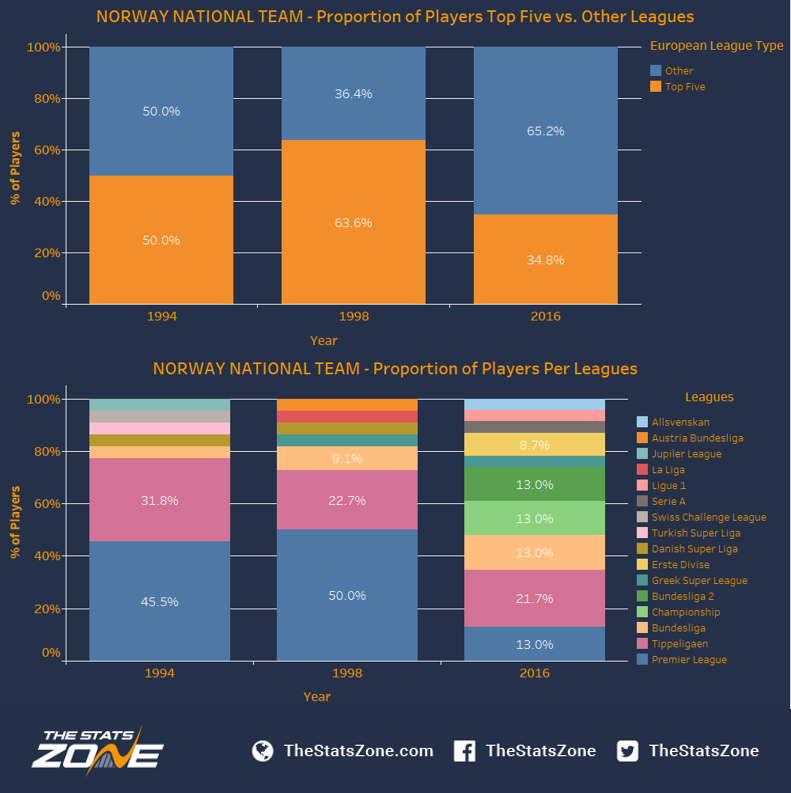
To get into the analysis we will start by looking at the Norwegian national team’s performance in recent years. This is visualised in a stacked bar graph with is split between the proportion of won, lost and drawn games. Next we look at the average number of goals scored and conceded (per game). This is visualised in a double bar graph where the blue bar reflect goals scored and the red bar within represents the number of goals conceded. The third graph shows the average supremacy (goals scored minus goals against) in a bar graph, where the line graph overlaid shows average points per game. Directly under this we find the fourth graph which demonstrates the Norwegian national team’s FIFA ranking in a line graph. The bar graph within illustrates the previous year’s ranking which helps show the significance in the change from one year to another. In the penultimate part of the analysis we are comparing the leagues in which the players for the Norwegian national team have competed. This is visualised in the fifth graph which is a stacked bar graph looking at the top five leagues (Bundesliga, Ligue 1, La Liga, Premier League and Serie A) vs. all other leagues. The sixth graph is an extension to this and follows the same structure but splits out each individual league specifically. Graph seven and eight also follow the same structure but look at the number of players who have played for teams in the Champions League (upper) and Europa League (lower). As a final analysis, we are looking at the performance in the U21 European Championship to see if this correlates with the results of the senior team.
From the first graph below it comes as no surprise that Norway showed the best winning record from 1995-1999, the period that we earlier referred to as the golden years. In this period, they won a total of 58% of their games. Furthermore, the proportion of lost games, which sits at 13% during these years, is also significantly lower than for any other period in the study. A further look at the losing record shows an increase in proportion of lost games from 1999 onwards, with the worst record between 2014 and 2016 when the national team finished a total of 47% of all games in a loss.
With this in mind, it is interesting to consider if the team’s struggle has been an issue of preventing goals or producing them. The graph below demonstrates that the best years for scoring goals were between 1995 and 1999 when Norway scored an average of 1.89 goals per game. The best defensive record is found between 1990 and 1994 when they conceded an average of 0.63 goals per game. Looking at the graph for goals conceded we can see an upward trend with a peak between 2014 and 2016 where they conceded on average 1.33 goals per game. Although the average goals scored per game was highest in 1995-1999 we can see that the goal average after this point stabilises, albeit the worst average is found in the far right bar at 1.00. With this in mind, it seems like Norway has experienced problems at both ends of the pitch but the defensive record has seen a more significant deterioration. It is clear from this graph that the main contributor to the success in 1998 was very much down to the strength of their offensive forces.
The top graph below displays average supremacy and points per game. In this graph the average points per game (line graph) was at its peak in 1997 and 1999, with a record of 2.33 and 2.42. In this graph it is also clear that the supremacy (bar graph) is positive between 1991 and 2000, confirming our previous observation that this period reflects the peak of Norwegian football at international level. Prior to this the team had a notably bad year in 2008 when their points per game average sat at 0.5. Between 2009 and 2010 it seemed that things were improving with the team showing a positive supremacy and winning between 2.00 and 2.33 points per game. However, this positive trend was only momentary and the performance from this point shows a downward trend with the worst record between 2013 and 2016 when their points per game average ranges between 0.92 and 1.25.
Moving onto the lower graph which investigates FIFA ranking, we can see that Norway was ranked fifth in 1993. The graph trends slightly downwards until 2008 when Norway was ranked 54th in the world. From this period the team started performing better and managed to climb to 12th in 2010. However, the period after this follows the trend we have previously discussed, with the team dropping down the ranking board reaching their worst position in 2016 at 81.
As Norway qualified for two consecutive World Cup competitions in 1994 and 1998 we have decided to compare the number of players also participating in different leagues each year. Looking at the top graph we can see that 1998 had the largest proportion of players in the top five European leagues at 63.6%, followed by 1994 at 50.0%. The lower table for these two season shows that a large proportion of Norwegian players played in the Premier League with a representation in 1994 of 45.5% and in 1998 at 50.0%. If we step back to the top graph we can see that only 34.8% of the players in the current squad play in any of the top five leagues in Europe. A closer look at the lower graph shows that the German Bundesliga 2 and English Championship represent 26% (13% each) of all players. It is remarkable how two second tier leagues can be so prevalent in a national team and offers a good explanation as to why the teams back in 1994 and 1998 performed better. Before we move on we can see that Tippeligaen (the Norwegian professional league) has a strong representation in each year’s squad, ranging from 21.7% to 31.8%.
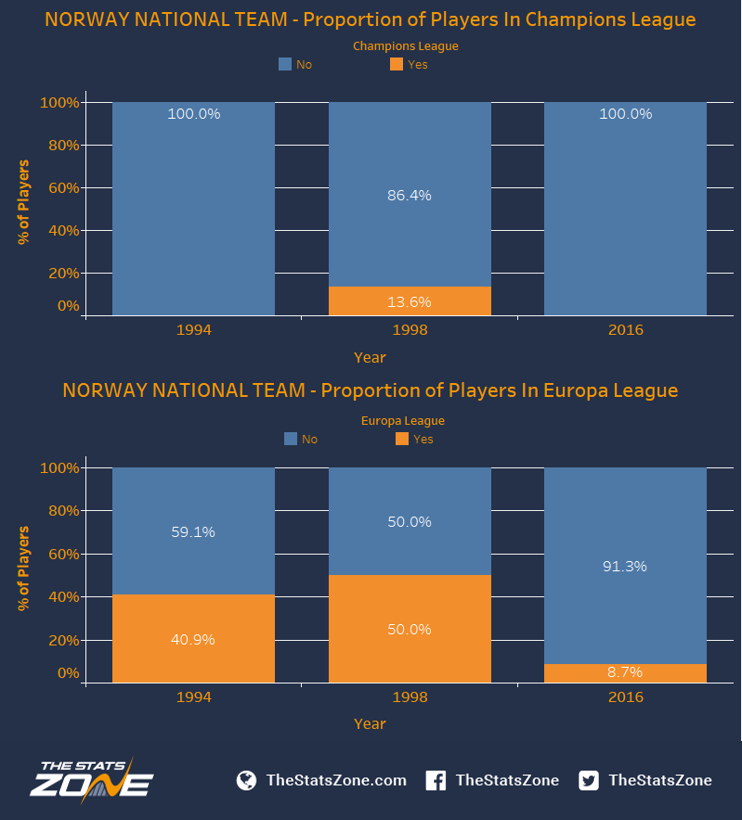
The next two graphs take this a little further, demonstrating the proportion of players of the national team who also play in the Champions League and Europa League. Interestingly, in 1994 there were no players participating in the Champions League (specifically the 94/95 season) but 40.9% were involved in other European cup competitions (Europa League). Moving onto the national team of 1998, we can see that the calibre of players in the team had improved significantly with 13.6% of all players playing in the Champions League, and 50.0% in any other European cup competition (98/99 season). A closer look into the raw data of this year showed three players played for Manchester United, the team that won the Champions League title in 1998/99. In contrast, in the team of 2016 only 8.7% of all players were also in the Europa League and notably no players in the Champions League (16/17 season). This provides evidence that the players were not of as high calibre, hence not making it into these leagues. The outcome of a weaker team in 2016 can be seen in the dip in result.
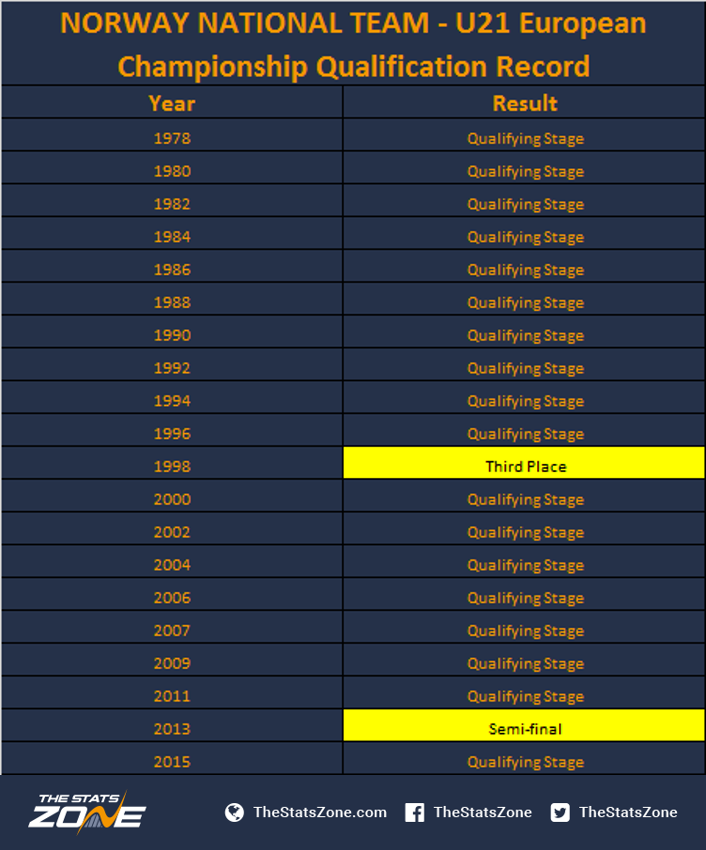
So it seems like aside from the golden generation, Norway have struggled to develop high quality players and this has led to poor results. The graph below will look at the performance of the U21 team in the European Championship to give an indication if this lack of ability is evident from the younger ages. Looking at the table below we can see that the best performing U21 team was also in 1998, when they finished third in the European Championships for this age level. Other than that, the second best record is a semi-final spot in 2013, so possibly the current Norway team may reap the benefits of this as these players move in to the senior team. The U21 team hasn’t managed to progress through the qualification stages in any other year of the study (a span of over 25 years), suggesting that the problem does lie in the youngest professional skill level.
If we take a moment to look at specific younger players from Norway who have drawn media attention, one of the names that springs to mind is Martin Ødegaard. We all know that he was the top target of many of the biggest European football clubs when he signed for Real Madrid in 2015. Although he is only 17 years old, it seems like he has hit somewhat of a wall since coming to Real Madrid with a halted progression, with most of his games coming for the second team, Real Madrid Castilla. This is just one example but unfortunately speaks for the rest of the developing Norwegian future potential players. Therefore, we suggest it is hard to see how the national team is going to improve in the near future, unless something extraordinary happens with their young players.
To sum things up: We have looked at the Norwegian national team and their progression since the early 90s, with the national team enjoying their peak in performance between 1995 and 1999. We have identified that this was driven by a particularly high scoring average, a decent supremacy as well as a high points per game average. The end product of this really showed in the countries FIFA world ranking as they achieved a position that they have struggled to reach since this golden era (only getting close in 2010 when the ranked 10th). When we compared the squads of 1994 and 1998 with the one today, we can confirm that the earlier years of Norwegian football contained more players in the top leagues and in particular in Premier League. This naturally results to a higher participation in the top European club competitions. It is easy to conclude that the Norwegian national team has gone through a rough patch and unfortunately from the stats very little suggests that this will change as their U21 team only has managed to qualify for one European Championship since finishing third back in 1998. As a final note, with the stats getting worse it is worth asking the question whether Per Mathias Høgmo is the right man to turn things around?


