Statistical insight into shootouts - where to place your penalty!
In the UEFA EURO 2016 final, France will take on Portugal with the winner being crowned European champions. The last time a penalty shootout decided the winner of the European Championships was when Czechoslovakia Defeated West Germany 5-3 in the 1976 final. However if there is one France and Portugal are very well matched in terms of their past success in penalty shootouts.
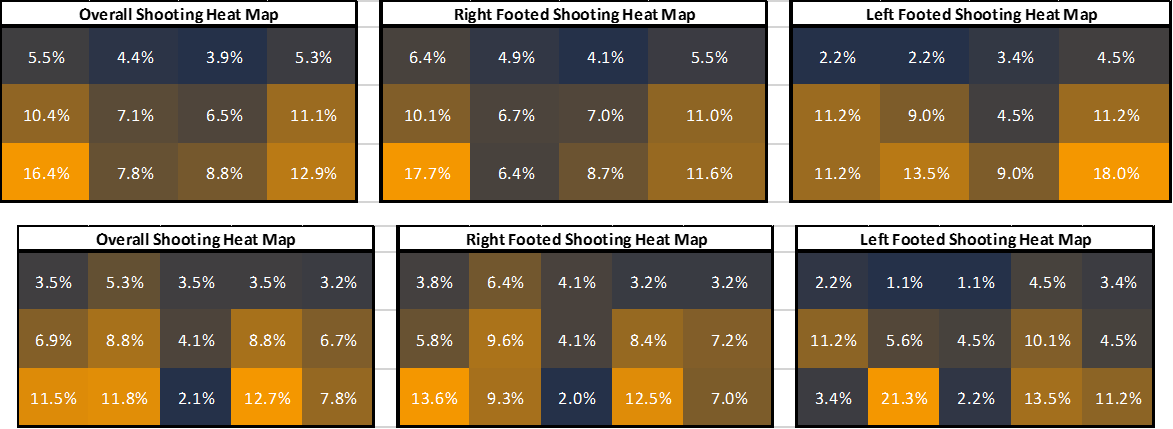
Here at TSZ we decided to take a closer look at all of the penalties taken in shootouts during the European Championships and the World Cup to see if there was anything interesting about them and to also see if there are any tendencies that exist. We were able to get footage of all of the 26 World Cup shootouts and all of the 18 European Championship shootouts. We plotted all of the penalties taken in the positions in the goal they were shot at (misses were plotted to the nearest area to the goal the ball went past). We plotted the shots in two configurations, configuration A is the UEFA standard in terms of shot positioning, configuration B was used so we were able to determine more accurately shots that go directly down the middle and increase the accuracy of our plots for shots to either side.

Additionally we recorded the direction the goalkeeper went during the penalty; either left, centre or right.
The first thing to look are the heat maps of where shots were taken. Below we have plotted the overall shot positions and then split that up based on the shooting foot of the penalty taker. The colour gets lighter as the percentage increases. As you can see by the lighter corners, players tend to aim towards them.
Scoring
So where do you get the highest chance of scoring. For this we’re bringing back our initial shot direction heat maps and below them comparing the % of shots that are scored in a position. The average scoring percentage for all penalties is 74.88%. So anything above that is a shade of green and below that is a shade of yellow fading to red as the percentage drops.
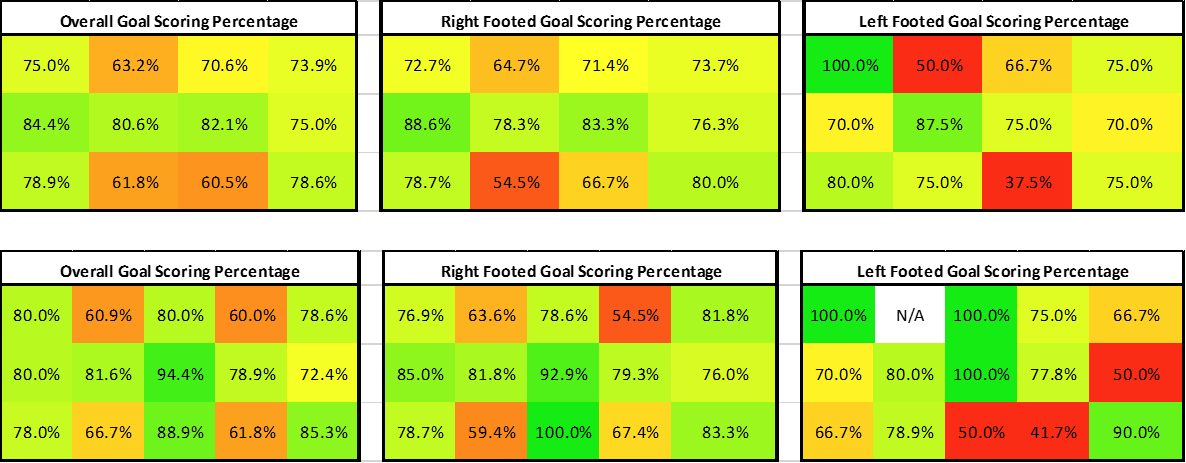
What we can see is that the best chance of scoring comes from aiming into the middle section of the goal and into the bottom corners.
The above plots include those shots where the penalty taker missed the target or hit the woodwork. If we remove those data points to imagine a player was able to always hit the target then does it change where the conversion rate is at its highest? The answer is yes, all shots to the top third of the goal that hit the target were scored. So this shows they are high risk, high reward options. However the percentage missed in these areas was higher than the others.
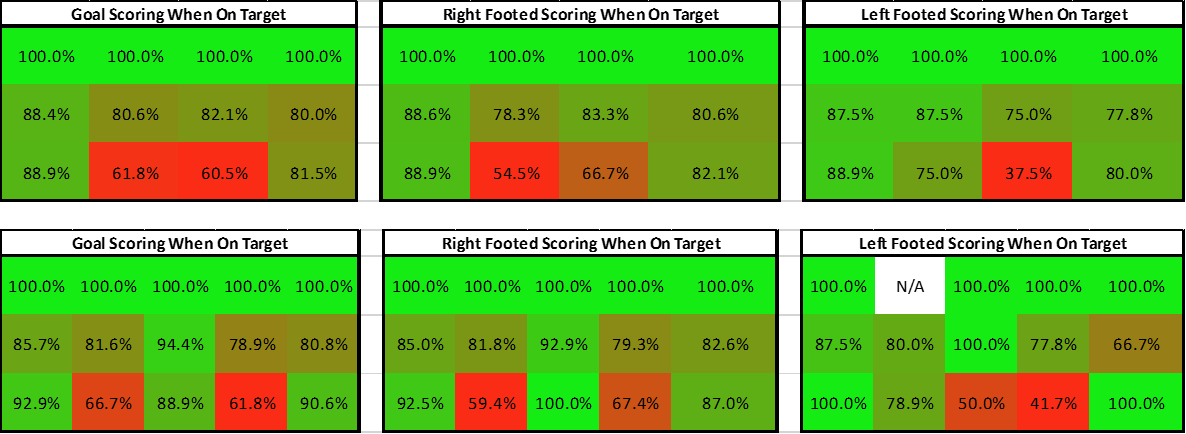
Goalkeepers
We wanted to see what goalkeepers chose to do in these situations as well so we’ve done the same with the goalkeeper movements.
From this we can say with a high level of certainty that goalkeepers have predominantly decided that they are a; going to dive and b; they make this decision before the penalty. The following plots show the percentages of where goalkeepers decided to position themselves based on where the penalty taker shot.

The most interesting statistic here is the staggeringly low amount of time the keeper chose to stay in the middle of the goal as opposed to diving to a side. We already know 9.7% of the shots go to the central fifth of the goal which is already lower than the expected 20% if all shots were shared equally, however over the central third there are an estimate 26.45% of shots taken and goalkeepers do not seem to have got this message. This is probably a mentality issue. Goalkeepers probably feel like it’s better to be active, making it look like you are making a real attempt to make a save rather than to be more passive in the centre of the goal and being (wrongly) accused of not trying. Below is the save percentage of for the goalkeepers based on their positioning

So what’s the best strategy?
It might be the boring option, but shooting straight down the middle is likely to give you the best results. It reduces your chance of missing and for the moment the goalkeepers tend to vacate that space. Obviously if every player does it then goalkeepers will start to adjust and stay in the middle more (which we think they should do anyway). But in a one off penalty shootout where the stakes are high and the adrenaline is running, most goalkeepers won’t happen to have the presence of mind to make the adjustment. It’s likely that adjustment would only come after a number of shootouts where players aim predominantly down the middle of the goal.
Some more statistical thoughts
With the sample that we have we found that teams taking the first penalty won exactly 50% of the shootouts. Our sample size is relatively small but there have been studies that have looked at 100s of shootouts and suggested that teams shooting first win slightly more often.
We also looked at the percentage of penalties scored by the penalty number. The results are tabulated below.

Who are they teams that are most successful?
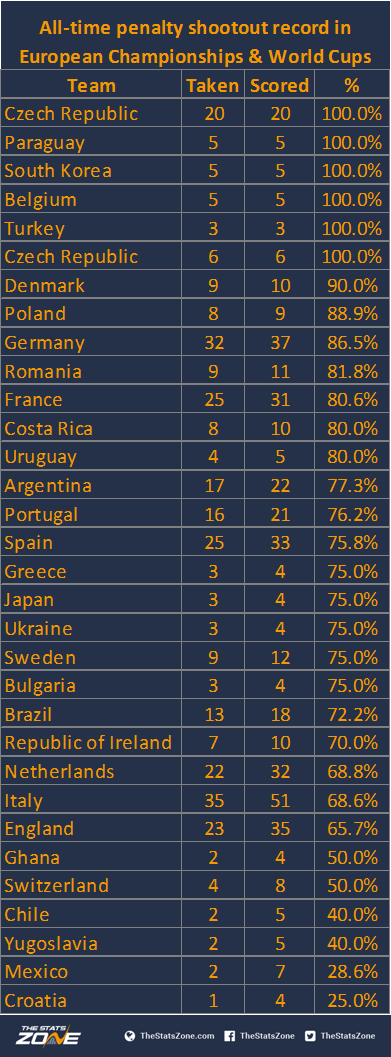
The table below shows the team by team conversion rate of all of their penalties taken. West Germany have been included under the umbrella for Germany and Czechoslovakia have been included as the Czech Republic. Surprisingly there are still a number of teams to not miss a penalty in a major championships. England fans can take a small amount of solace in the fact that there are quite a few worse than them.
