Rio 2016 - Forecasting The Medal Table
This week the world’s biggest sporting event – the Summer Olympic Games – will start its 31st edition, being held for the first time in South America with the most number of events, participating nations, and awarded medals. These three factors have been constantly growing since the 1988 Summer Olympic Games after the significant boycotts in 1980 and 1984.
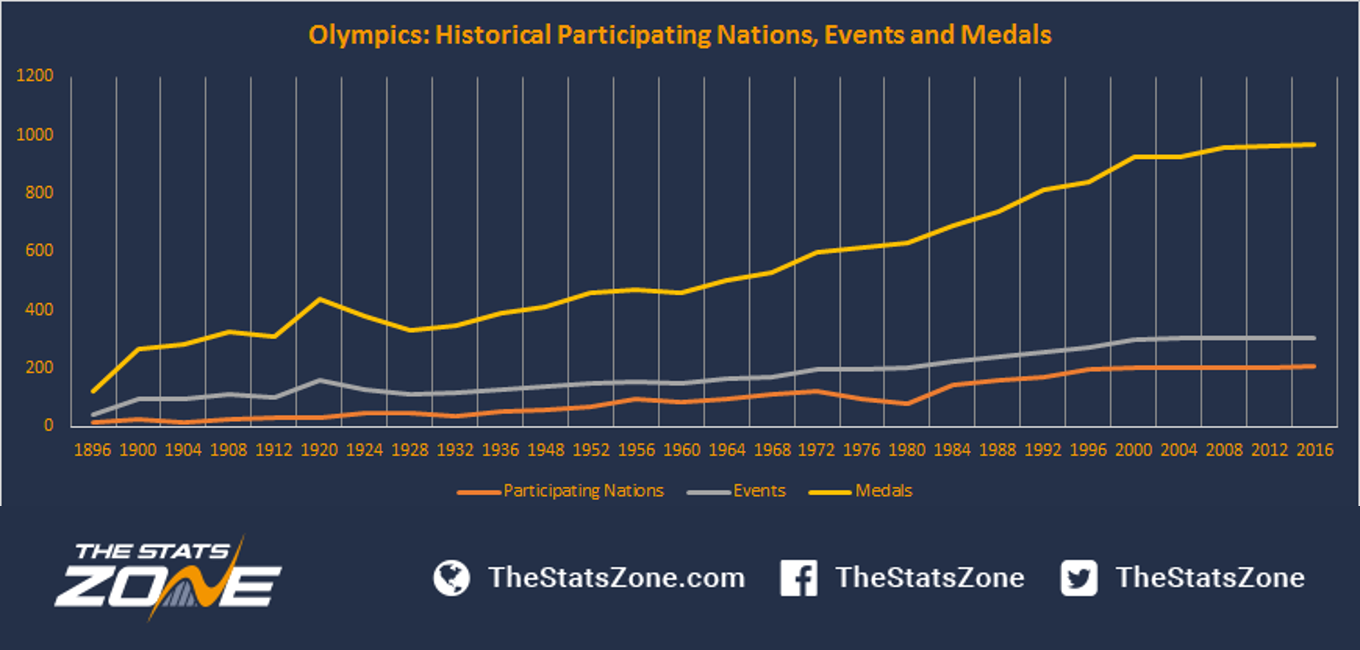
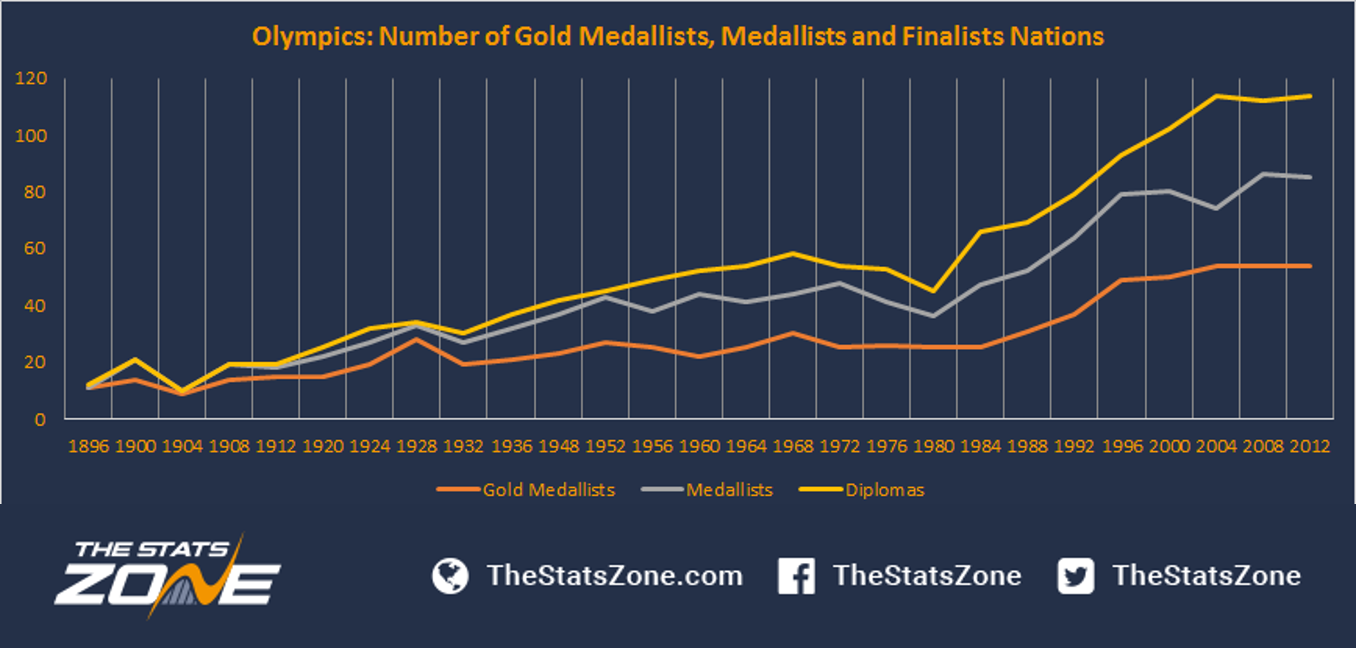
This growth is a result of the IOC’s objectives to include the maximum number of participant nations as well as include events which are globally popular, not only to provide chances to all nations to achieve a significant result but also to increase the competitive balance in the Summer Games. The graph below shows the effectiveness of these strategies adopted by the IOC. The number of nations achieving Gold Medals, any Medals and an Olympic Diploma (The Olympic Diploma is a paper certification given to the top 8 finishers in the Olympic Games, which are also called finalists) has been increasing alongside the growth of the three factors listed previously.
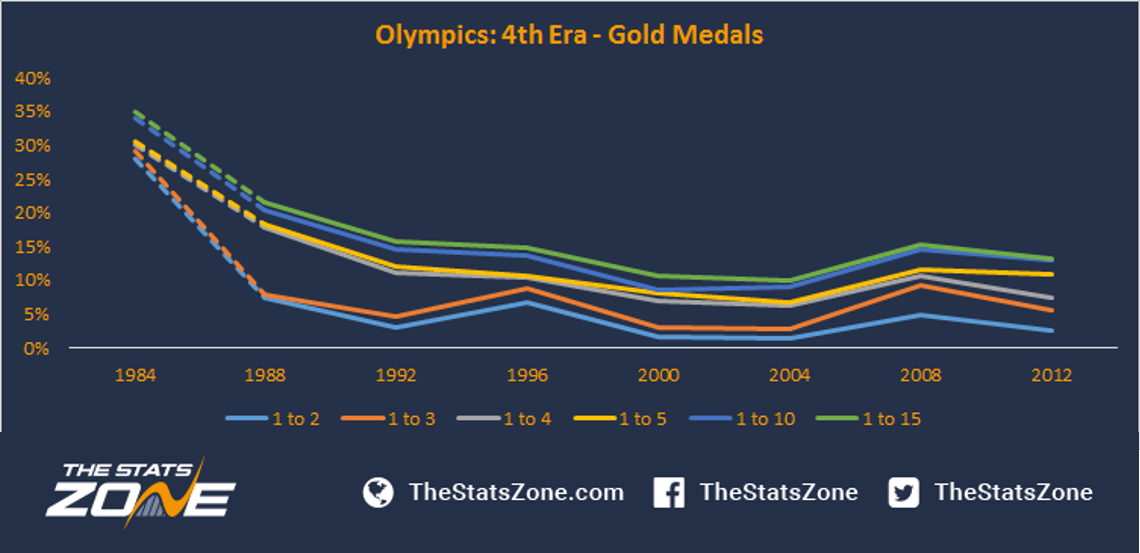
The effectiveness of the actions taken by the IOC to increase the competitive balance in the Summer Olympic Games can be seen in the graphs below, considering the relative number of gold medals and total medals difference between the first place (in each ranking criteria: Gold Medals table and Total Medals table) and the second, third, fourth, fifth, tenth and fifteenth position, you can see that the Summer Olympic Games balance consists of four eras.


The first era, before World War II, had an inconstant balance between the first place in relation to other positions, especially in the 1904 edition held in St. Louis, USA. This was the first edition of the modern games held outside Europe, and due to the tension caused by the Russo-Japanese war in Europe and the logistical issues of getting into the second largest city in Missouri, the III Olympiad had the all-time least number of participating nations (12 nations comparing to 14 nations in the first edition of the Summer Games). As a result, the USA won 81.3% of the Gold Medals and 85.4% of the Total Medals, resulting in the most unbalanced Olympiad.
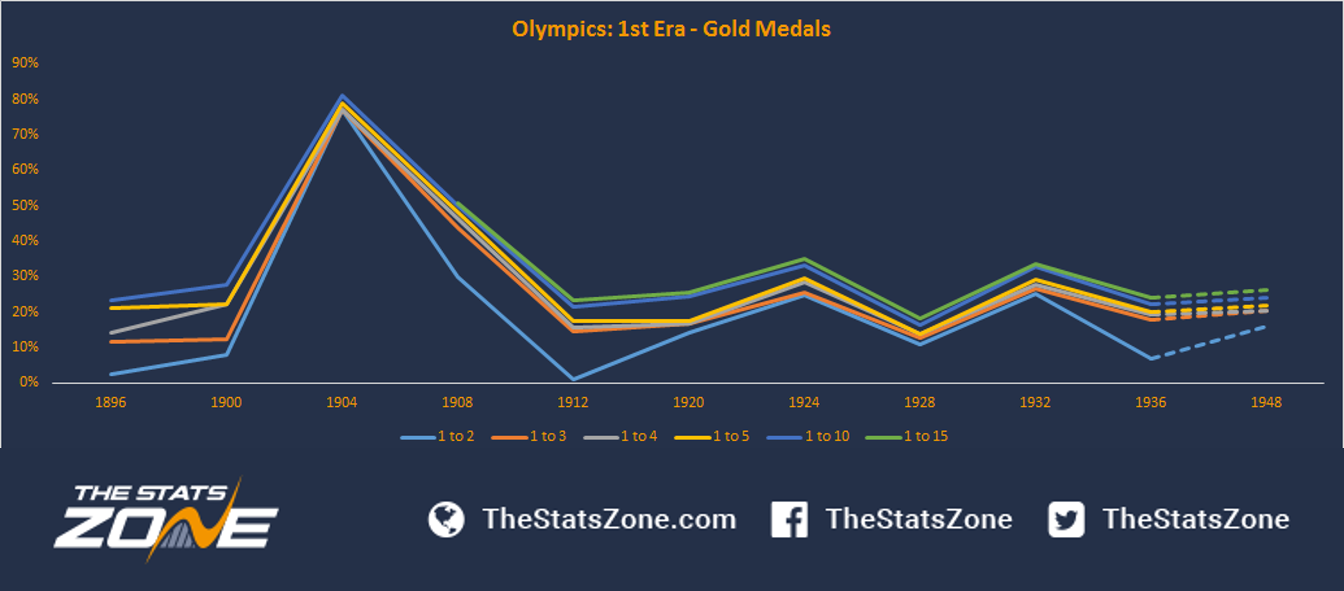
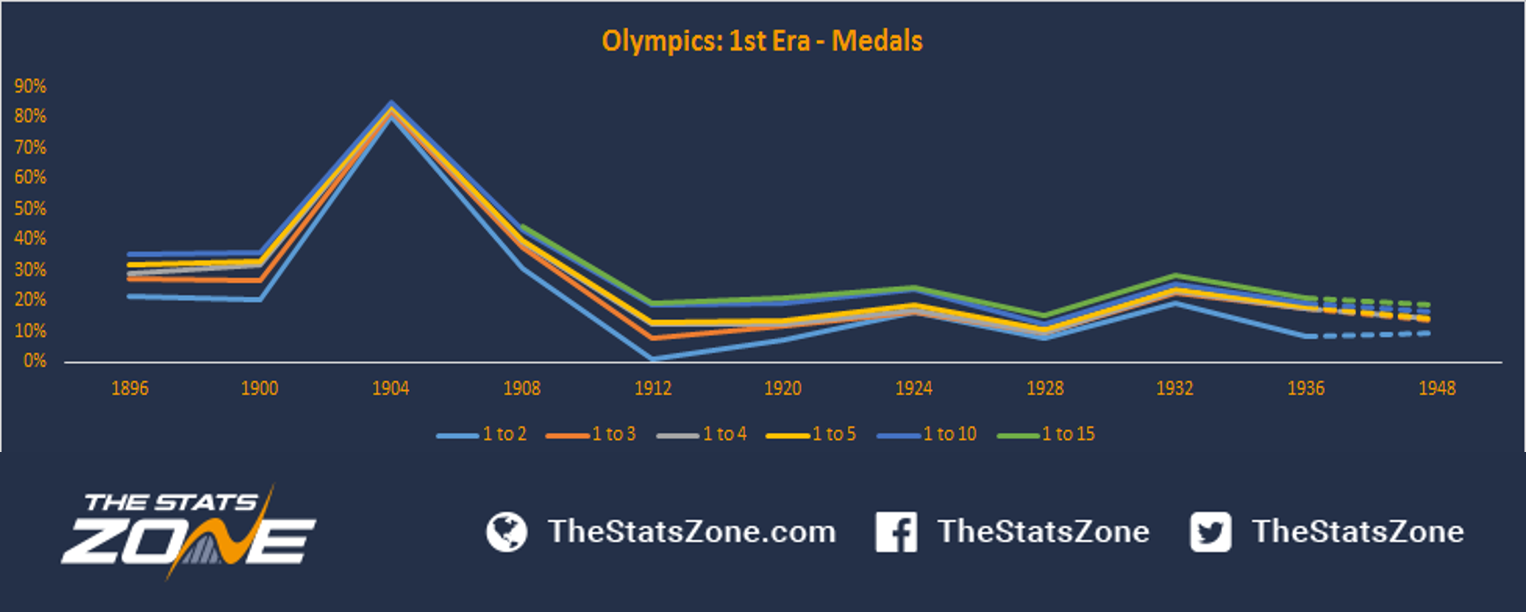
The second era, after World War II until 1976, had a constant balance in its first half (1948-1960) and, in the second half of this era (1964-1976), the balance was also constant but slightly more competitive. Nevertheless, the third era of the Olympic Games (1980 and 1984) was a breakthrough in the competitive balance of the Olympic Games. Due to several conflicts between the most representative nations of the Games, the USA and the Soviet Union boycotted the Moscow 1980 and Los Angeles 1984 Games respectively after sharing the top two positions from 1952 to 1976 in the Gold Medals table (Except in 1976, when East Germany finished in second and the USA in third) and Total Medals table. The boycotts resulted in a considerable advantage to the host nations, who enjoyed the advantage and had substantial achievements in those Games.


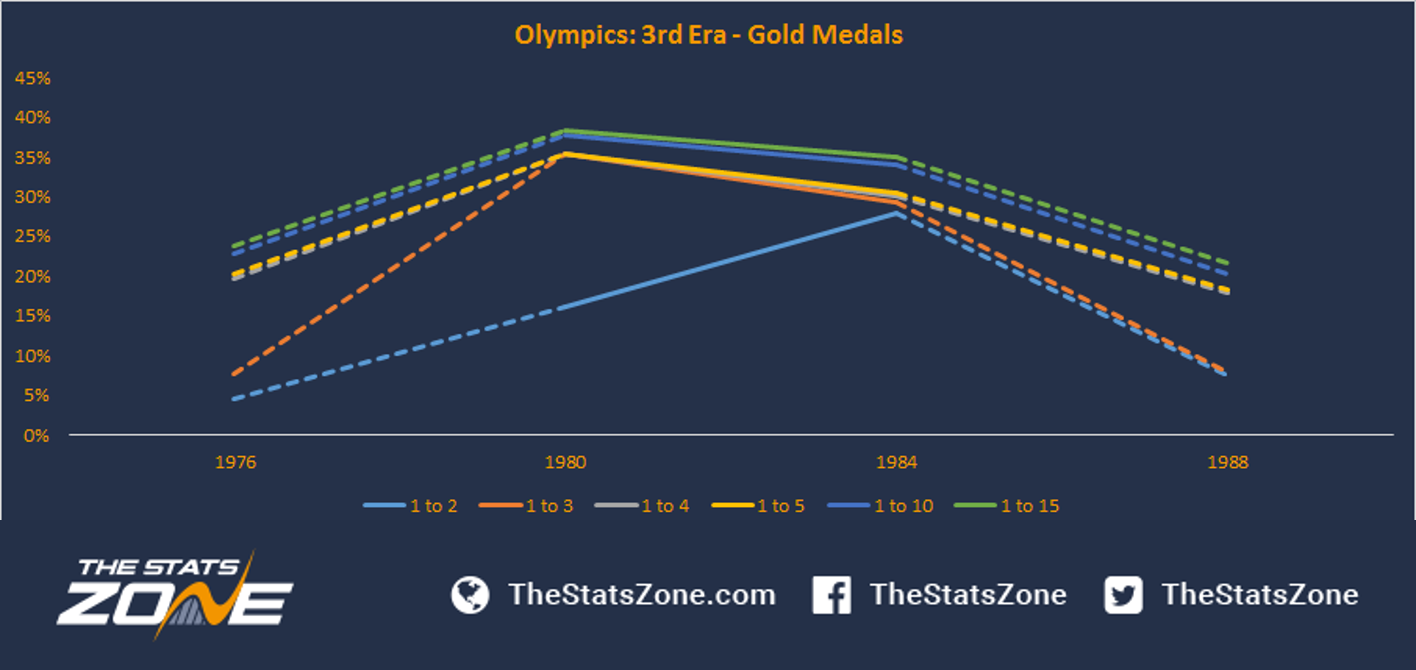

The fourth era, 1988-today, have seen an increased number of participating nations, events, and awarded medals. Consequently, the competitive balance improved to a level where the difference of relative Gold Medals and Total Medals between the first place and the other six positions listed in the graph above are smaller and closer to each other in relation to other eras. Hence, as this era reflects the current balance and features of the modern Olympiad, this analysis will analyse the Olympic Games from 1988 to 2012 in order to achieve a more precise and accurate outcome.

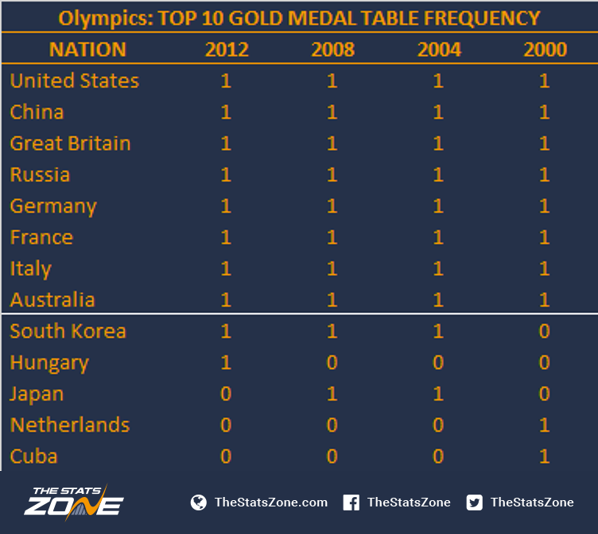
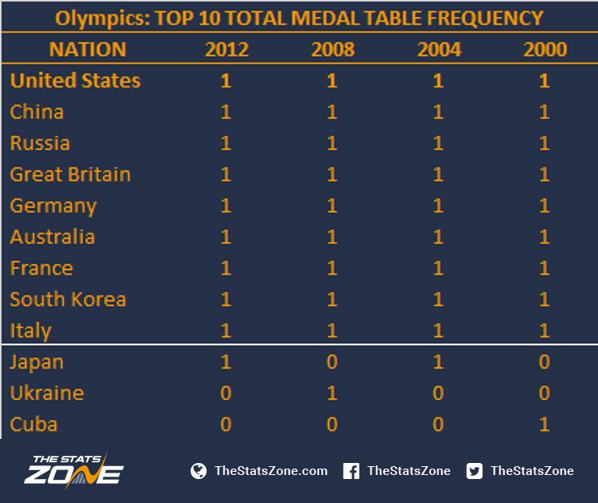
Even with a more balanced competition, there still exists a substantial achievements gap between several nations at the Olympic Games. Looking at the top 10 nations in the Gold Medal ranking in the last four editions of the Games, the top nine positions were composed of the same nine nations, with the exception of South Korea in 2000, and also saw a total of 13 nations reaching the top 10 places within this period. On the contrary, at the top 15 Gold Medals ranking, there is much less consistency of nations (23 nations). Also, similar figures can be seen in the Total Medals table, indicating similar behaviour between both ranking tables. Thus, the Olympics have constant top nations in the battle for the top positions, while at the same time several nations struggle to keep its consistency lower down in the ranking tables.
The fact that these nations are constantly placed in the top positions is a result of huge investments and policies created by governments to improve their nation’s performance at the Olympic Games, resulting in several benefits such as providing a national ‘feel good’ factor, international prestige, economic impact by hosting the Games, and domestic political benefits alongside a wide range of factors. For instance, the Australian government decided to create the Australian Institute of Sports along with extensive investments to improve the nation’s performance in the Olympic Games after a poor performance at the 1976 Montreal Olympics. Similar to Australia, the United Kingdom had a similar approach to develop its elite sports in 1995 just before a poor performance in 1996. Also, in China, the government initiated an Olympic strategy in 1985 after its first participation in 1984 since 1952 to become one of the top sports power in the late 1990s by changing its structure, creating policies and investing large amounts of money in elite sports development. These are a few examples of nations who have invested substantially in elite sports development.
Nonetheless, not all nations are successful at remaining in or reaching the top positions in the Summer Olympic Games by creating policies and investing heavily in elite sports development, owing to several reasons which can range from size of population, wealth and sport popularity (for instance, Nordic nations prioritise the Winter Olympic Games). Although, the success of each nation can be determined by their strategies based on their own macroeconomic variables such as wealth and population. Based on the China, Australia, and United Kingdom examples above, China has a decentralised approach by not focusing the investments and policies in a wide range of sports/events owing to the country’s large population and wealth. On the other hand, with a smaller population and wealth, Australia and the United Kingdom have a centralised strategy in a few sports/events to achieve their aims of being placed within the top ranked nations. Both strategies seem to be effective as the sports/events chosen to take part in the Olympic Games provide different numbers of medals. For instance, the world’s most popular sport, Football (which can be played in a range of environments), can provide a maximum of two medals for a nation while Rowing (which needs a certain type of river, lake, or artificial structure to practice) can provide a maximum of 14 medals for a nation. Also, independently of the chosen strategy, all nations included hosting the Games in their plans to pursue economic, social, cultural and other benefits.
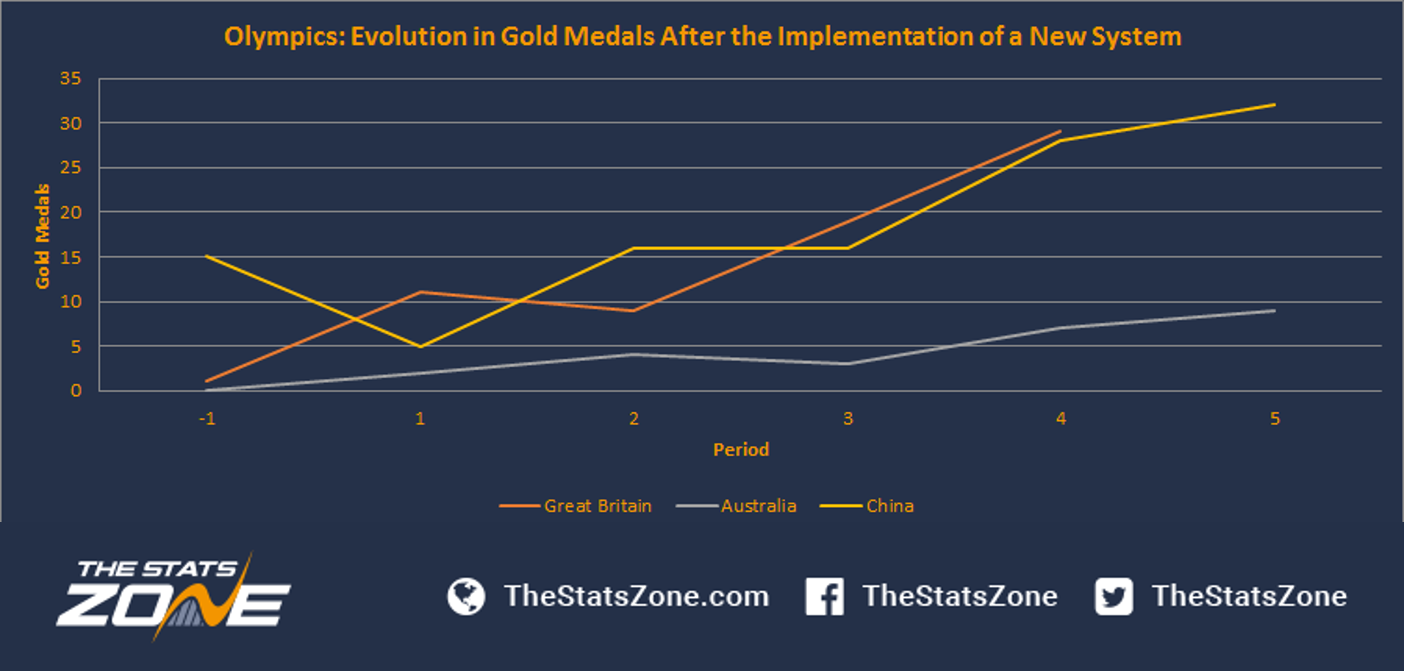
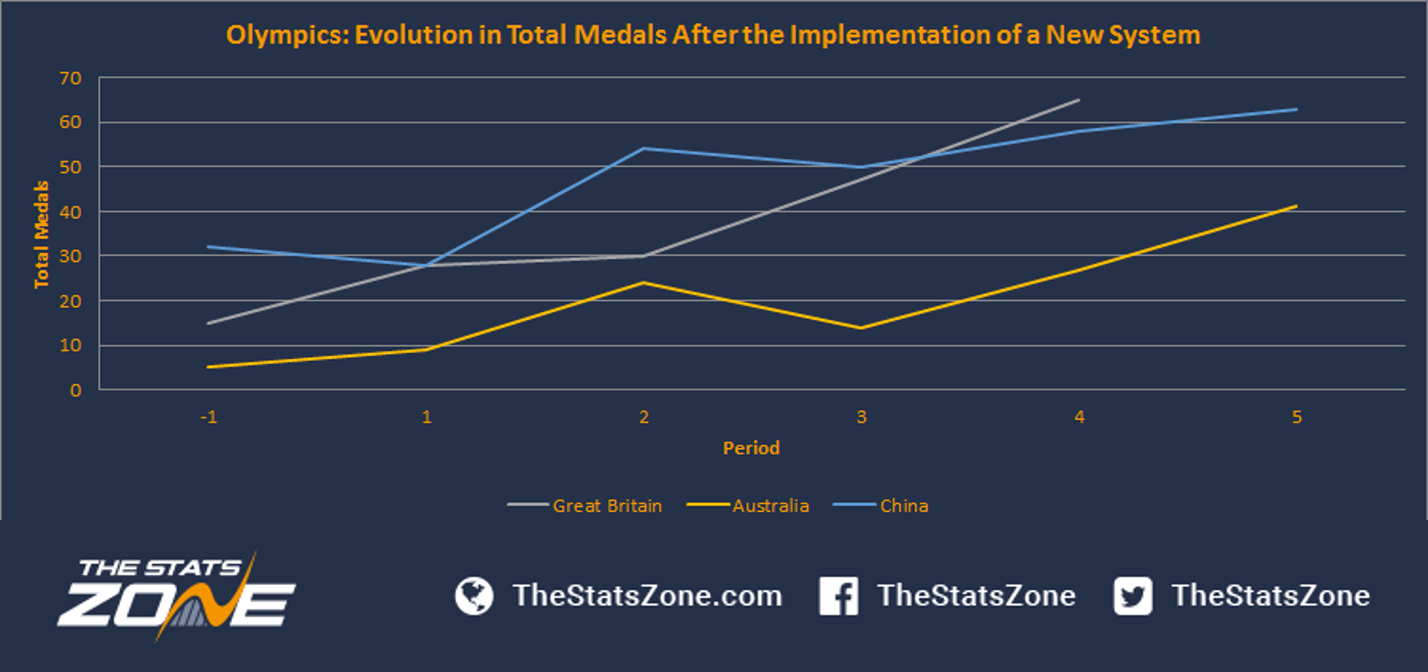
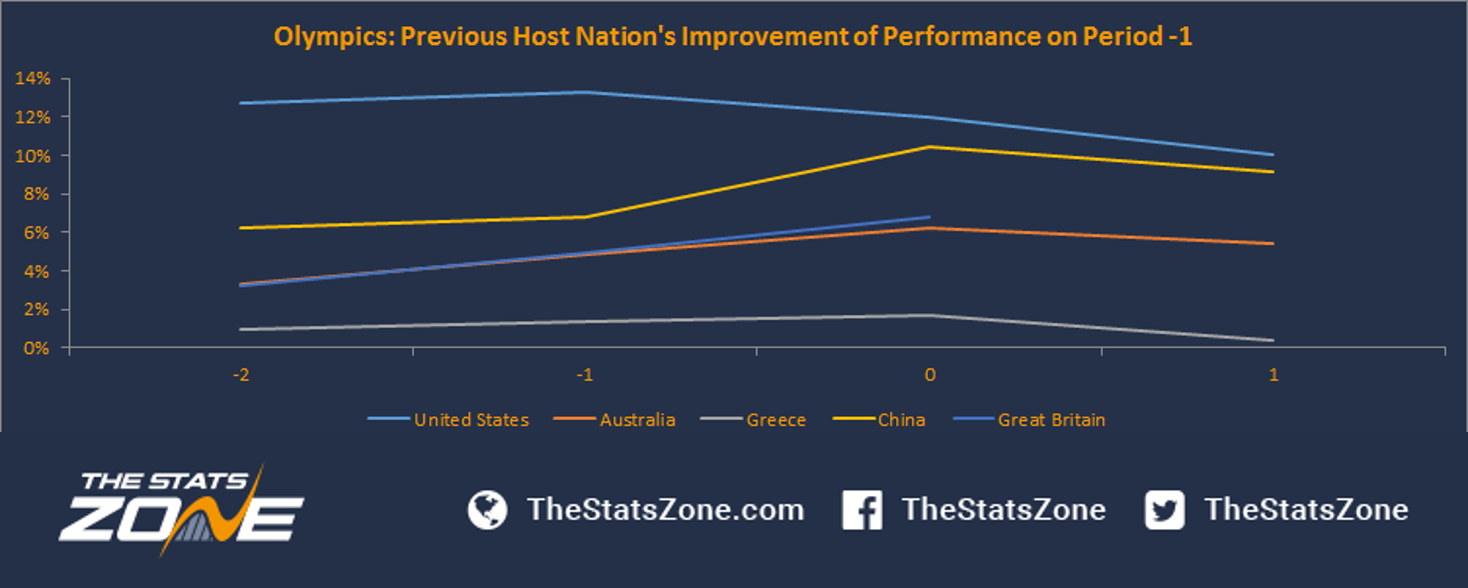
Looking at these three graphs, it is clear that there is no substantial improvement of performance in the first Summer Olympic Games edition following the new elite sports system implementation, although there is a gradual improvement throughout the following editions. Moreover, the improvements can be found not only in the Olympic Games, but also in other elite sports/events competitions such as World Cups and Word Championships.
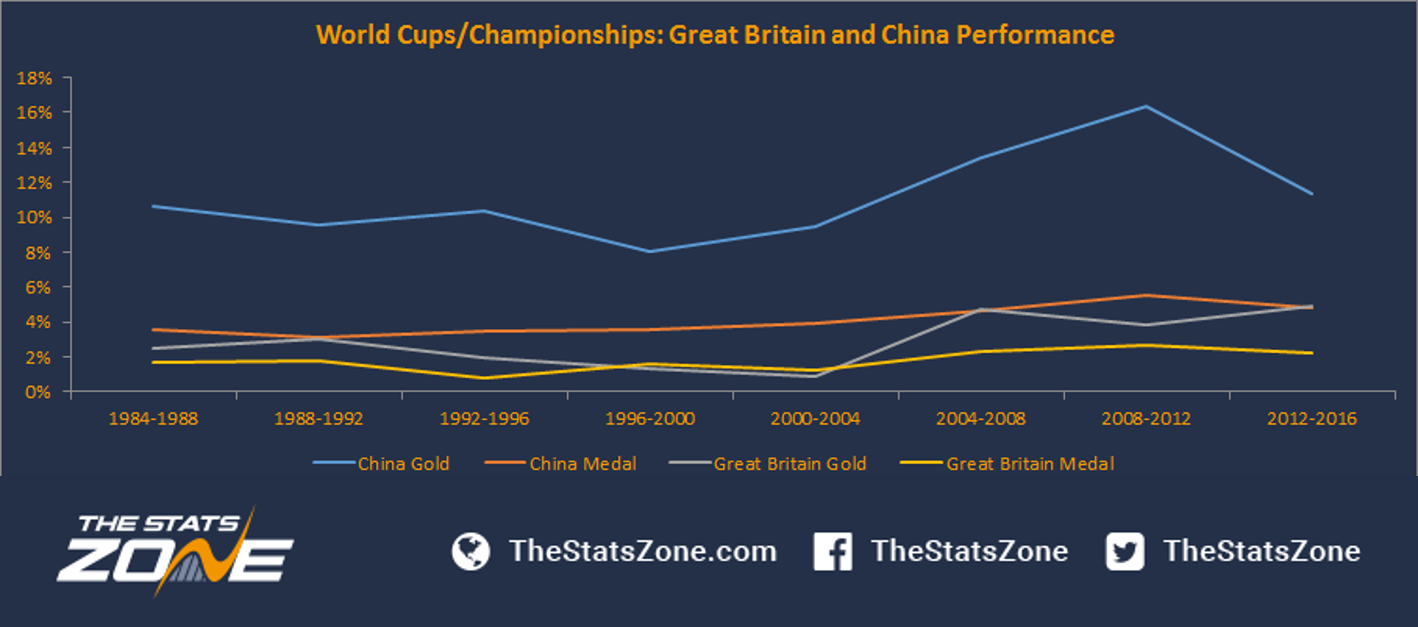
The fact that both countries had improved performance after adopting new strategies to achieve top positions in the Olympics rank table is not a one-off occasion. The performance of both countries between the World Cups and World Championships in an Olympic Cycle has a strong relationship as highlighted in the table below. Hence, as the top 10 nations are constantly placed within the top 10 Gold Medal and Total Medals rankings in the Olympic Games, there is a strong correlation in some of these nations between their performance in elite competitions and Olympic Games within an Olympic Cycle. Thus, this analysis will forecast their performance at the 2016 Rio de Janeiro Olympic Games based on their performance in the 2012-2016 Olympic Cycle.

In order to select the nations with a potential to finish within the top 10 places in Rio 2016, this analysis looked only at the nations who finished within the top 15 Gold Medals rank table in the past four Olympic Games. In addition, as there were a different number of medals between these editions, the analyses will consider the share of medals achieved by each country instead of a number of medals, to provide a more accurate and precise forecast. Moreover, as usually the host country has an advantage in relation to other nations, Brazil was included in the analysis.
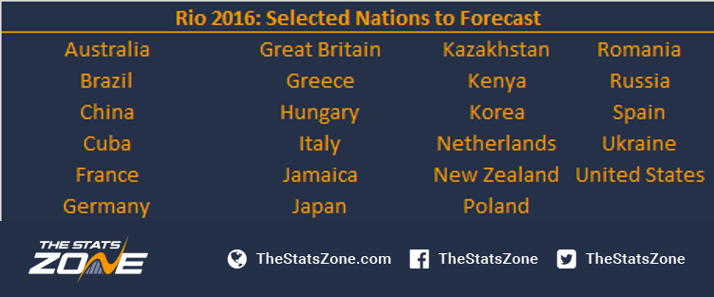
Looking at the relationships between their performance in an Olympic Cycle and the Olympic Games between 1988-2012, most nations had a strong correlation between the Medals achieved in World Cups/Championships and Gold Medals in Olympic Games, and more strong correlations between Medals achieved in World Cups/Championships and Medals in Olympic Games, just as the previous example of China, Great Britain and Australia. This Indicates that the number of medals achieved by a nation in an Olympic Cycle is a better reference to forecast their Olympic Games results.
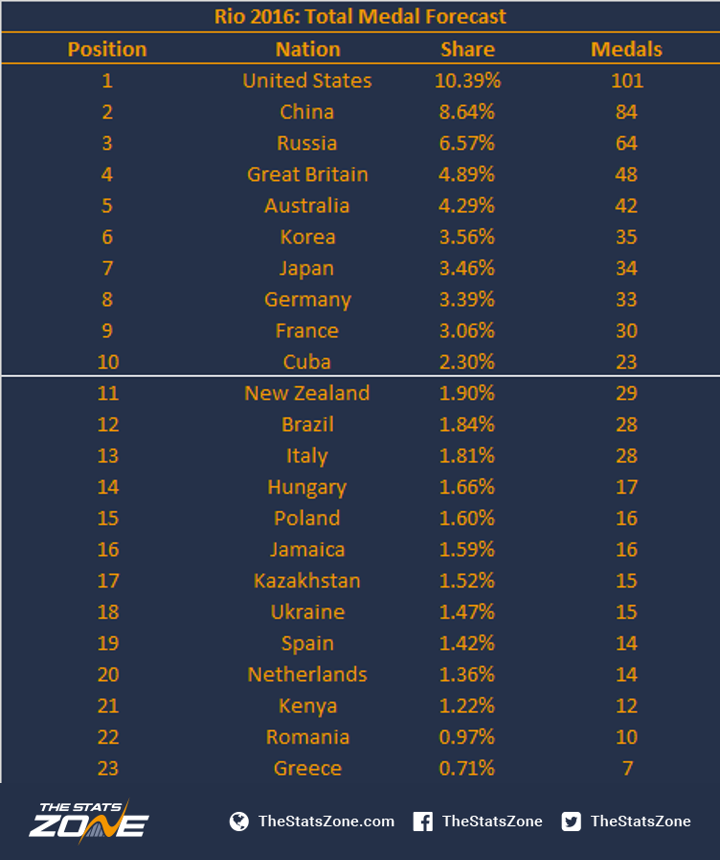
The forecast indicates that the USA might finish in first position in both table rankings with 13.04% of the Gold Medals and 10.39% of Total Medals, followed by China by a close difference of less than 1% of Gold Medals and less than 2% difference in the share of the Total Medals. On the other side of the top 10 ranking, the gap between the 10th and 11th place is tighter with 0.03% only, which indicates that the tenth place might be defined on a number of Silver or Bronze Medals in the Gold Medals table. Also, the 10th place battle in the Total Medals ranking might have a difference of 0.4% of the share only. Furthermore, from the constant top 9 nations, Italy seems to be losing their top 10 position in both table rankings for the first time since 1992, In addition, the two nations to complete the top ranking are Japan and Jamaica in the Gold Medal ranking, and Japan and Cuba in the Total Medals ranking.

The achievement of Japan in Rio 2016 would not be an unexpected event, as a similar increase of performance by future host nations in a previous edition happened before; all host nations in the 1996-2012 sample range had improved performance in an edition prior to hosting the Summer Olympic Games.
This forecast provides the possible results for Rio 2016, not taking into account two important factors that might provide substantial changes in the top 10 ranking for both table rankings. The first factor is the suspension of Russia in a range of sports/events after their doping scandal. So far, Russia have been completely banned for the Athletics and Weightlifting competitions, partially banned for the Aquatics, Canoeing & Kayaking, Cycling, Modern Pentathlon, Rowing, Sailing and Wrestling Competitions, completely accepted to Archery, Badminton, Equestrian, Fencing, Judo, Shooting, Table Tennis, Tennis, Triathlon and Volleyball competitions, while Boxing, Golf, Gymnastics, Handball, and Taekwondo await a final decision.
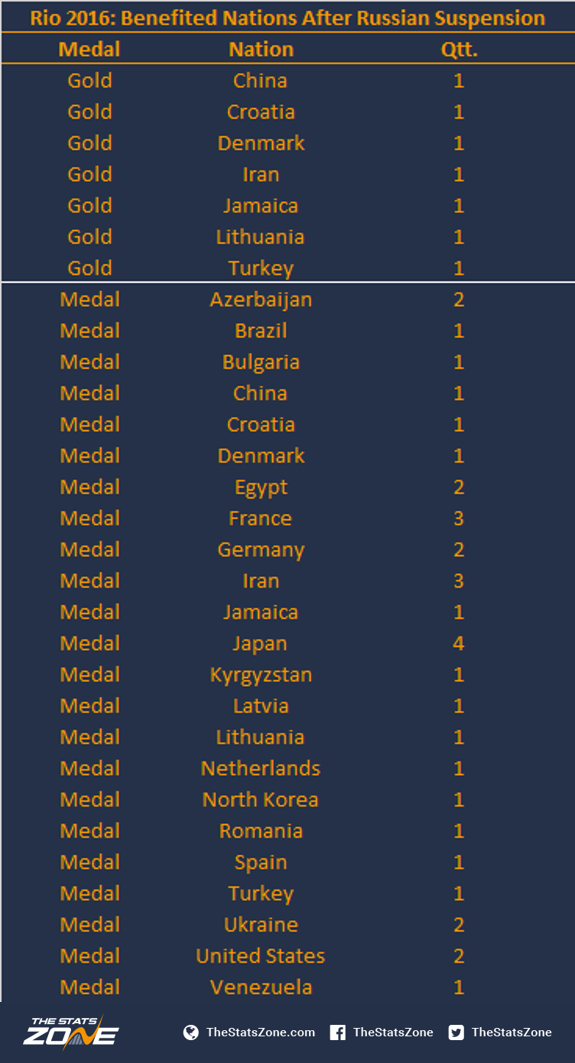
With the ban, Russia would be expected to lose two Gold Medals (China and Jamaica would win a Gold Medal) and 35 Medals in the World Cups/Championships within the 2012-2016 Olympic Cycle. The table below indicates that Japan, France, and Iran would be the most profited nations from Russia’s absence, and also it would cause a considerable change in the forecast of both ranking tables.
Because of the ban, Russia might end the competition placed outside the top 10 in the Gold Medal ranking by finishing in 12th position, and would finish in 10th place in the Total Medals Ranking. In addition, China might equalise the USA in the Gold Medals table and possibly the 2016 Rio Olympic Games would be decided on Silver or Bronze Medals. Furthermore, almost all nations ranked in the top 10 positions of both rankings would win a position in the rank table, with the exception of Germany, who would gain two positions in the Total Medals table by overcoming Korea.
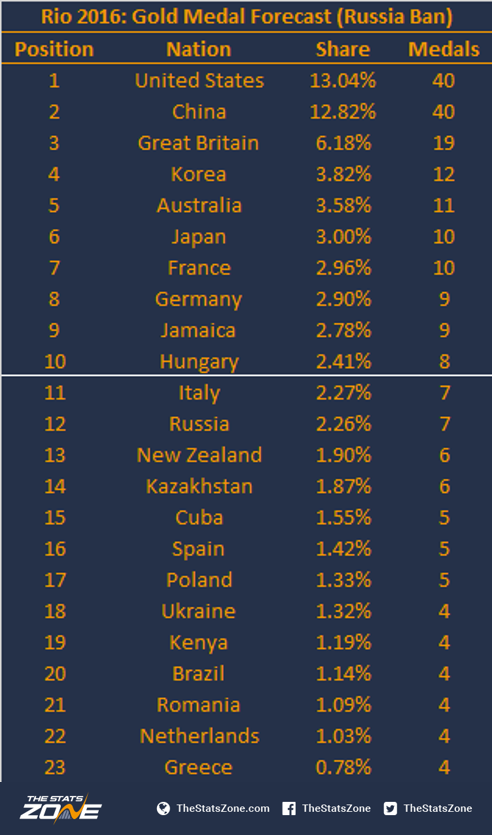

The second factor is the Brazilian advantage by hosting the competition. Considering Team Brazil’s past performance and past home advantage of a host nation in previous Olympic Games, Brazil would increase their Gold Medal and Total Medal tally by hosting the next Olympic Games. Considering the forecast made after the Russian ban, Team Brazil might raise their Gold Medal tally from four Gold Medals to 11 Gold Medals, which would shift the nation from 20th position in the Gold Medals table, leaving Hungary outside the top 10 Gold Medals ranking. In the Total Medal Ranking, Brazil might also finish in the top 10 nations by increasing their Medal Tally from 19 medals to 36, shifting the nation from 11th to 6th position, and as a result Russia would be outside the top 10 ranking of both medals table.
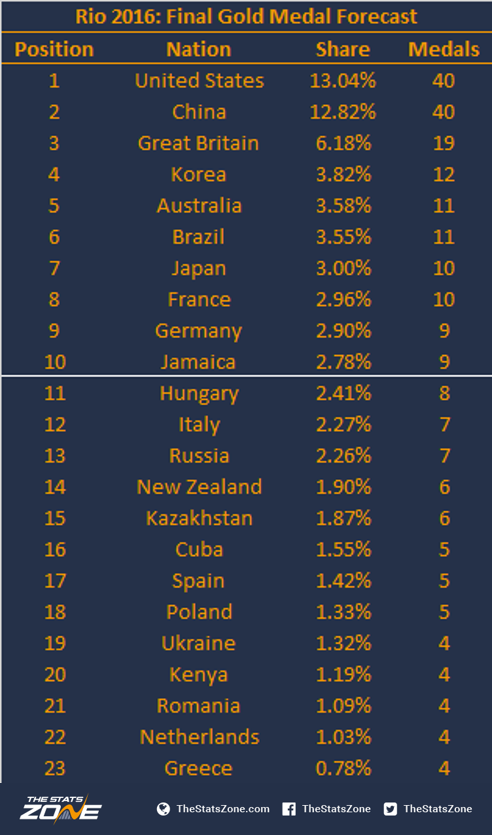
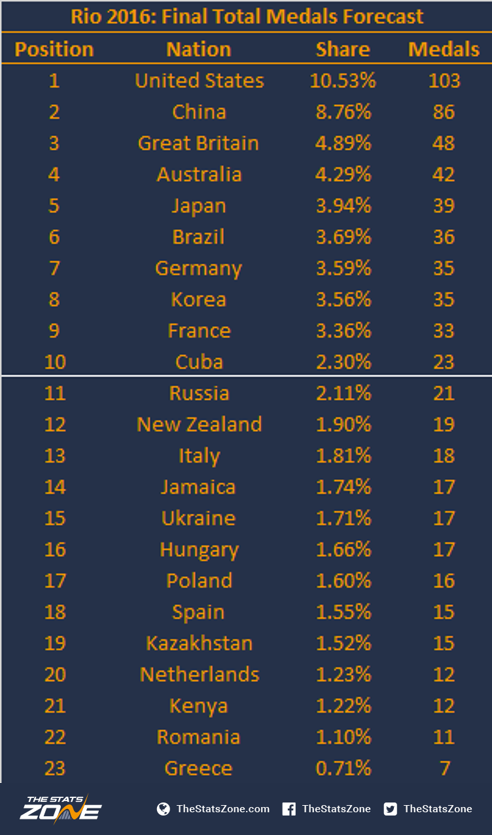
Considering the fact that Brazil might win these medals owing to their home advantage, some other nations might lose medals. As it is difficult to pinpoint which sports/events Team Brazil might win these additional medals, the table below shows the nations who were medallists in the same disciplines in which the Brazilian team was finalists, indicating which nations might be harmed from Brazil’s home advantage.

Hence, some nations would still shift places in both tables depending on which competition Team Brazil might win the home advantage medals. Of course, many other factors can influence the Olympic Games results. These factors can come from a simple misjudgement of a referee, 0.01 seconds difference in a racing event, an important athlete injury (i.e. Usain Bolt for Jamaica), travelling distance from countries that are far from Brazil and time difference, climate difference (This will be the third time the Summer Olympic Games will be hosted in the Southern Hemisphere, so it will be the third time the Games will be hosted during the Winter season in the host country), and several other factors. However, it seems that the battle for the first place will be very competitive, Italy may underperform whilst Brazil and Japan might overperform, and the Russian ban will considerably affect the final tables ranking.
Medals image courtesy of VectorOpenStock


