In-Depth Statistical Analysis Of LA Galaxy’s Opposition Goalkeepers In The 2016 Season
As an extension to our previous piece on LA Galaxy’s goalkeepers, this article analyses the stats around the goalkeepers in teams that LA Galaxy faced during the 2016 MLS regular season, using our bespoke data collection.
In the previous piece, we touched upon the fact that the role or the modern goalkeeper has undergone some changes in recent years, or at least, it has under coaches such as Pep Guardiola, who insists that his shot-stopper should be adept with his feet and be able to play the ball out comfortably from the back. Defensive play in general has also evolved to a degree, as whilst traditionally the focus was on a team’s own defensive third, the answer isn’t quite as straight forward nowadays; the German manager Jürgen Klopp took the world of football by surprise when he popularised the concept of “Gegenpressing”, a tactic in which when a team loses the ball, they instantly attempt to win back possession, rather than falling back to regroup. According to Klopp, there is no better way to create chances than “Gegenpressing” and the defensive work starts as soon as the opposition has won the ball, regardless of this being the goalkeeper, defender, midfielder or attacker.
With this in mind, this article takes the same structure of the previous study (which focused on LA Galaxy’s own goalkeepers). We want to understand how LA Galaxy went about pressing their opponents’ goalkeepers. As an extension to this, we want to explore if their opponents use certain distribution types and what targets they have a propensity to go for. This could create a foundation to understand the areas in which the team regain possession and help us to provide suggestions around how tactics can be tailored accordingly. To finish off the analysis, we look at what section of the goal LA Galaxy had a propensity to shoot at, and where most shots were converted into goals. Again, this provides intelligence around where LA Galaxy should be trying to set up their strikers and focus their training to increase accuracy. This article has the exact same structure and restrictions as the previous article, and we refer to this if any additional explanation is needed.
The graph below shows the distribution success rate of LA Galaxy’s opposition goalkeepers whilst their respective teams were leading a match:
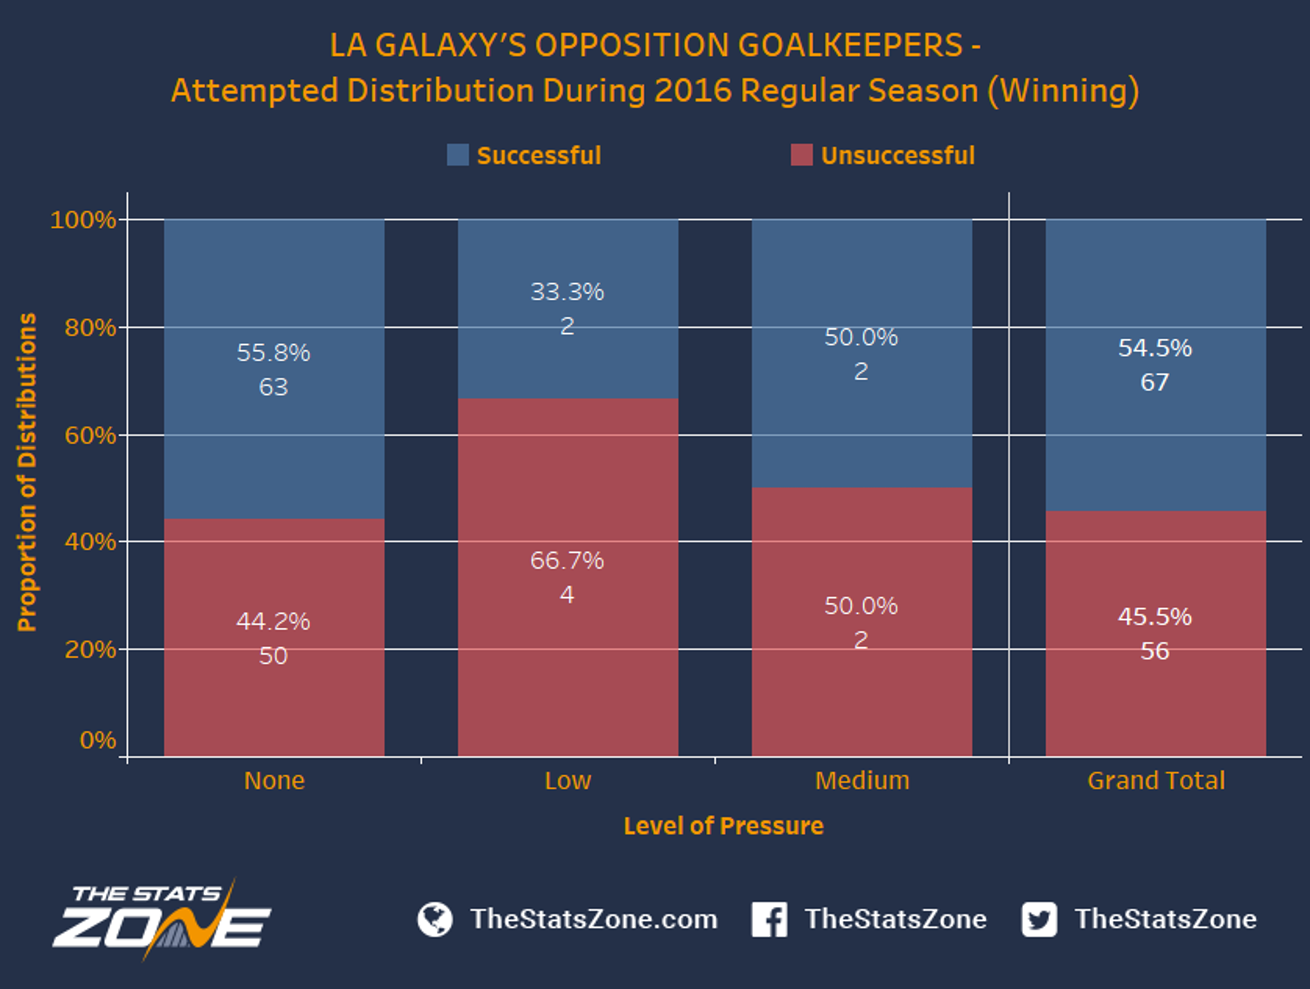
The graph above shows, as expected, that the success rate is highest when no pressure is put on the goalkeeper. However, it is notable that the success rate is higher under medium pressure than under low pressure, which goes against the initial hypothesis. There were no instances of LA Galaxy applying high pressure during a time in which their opponents were winning. The overall total is 54.5% distribution success while the opponents were winning (LA Galaxy losing). The raw numbers within the graph show that the vast majority of distributions came when no pressure was applied by LA Galaxy players.
We now move on to the distribution success rate whilst the game was tied:
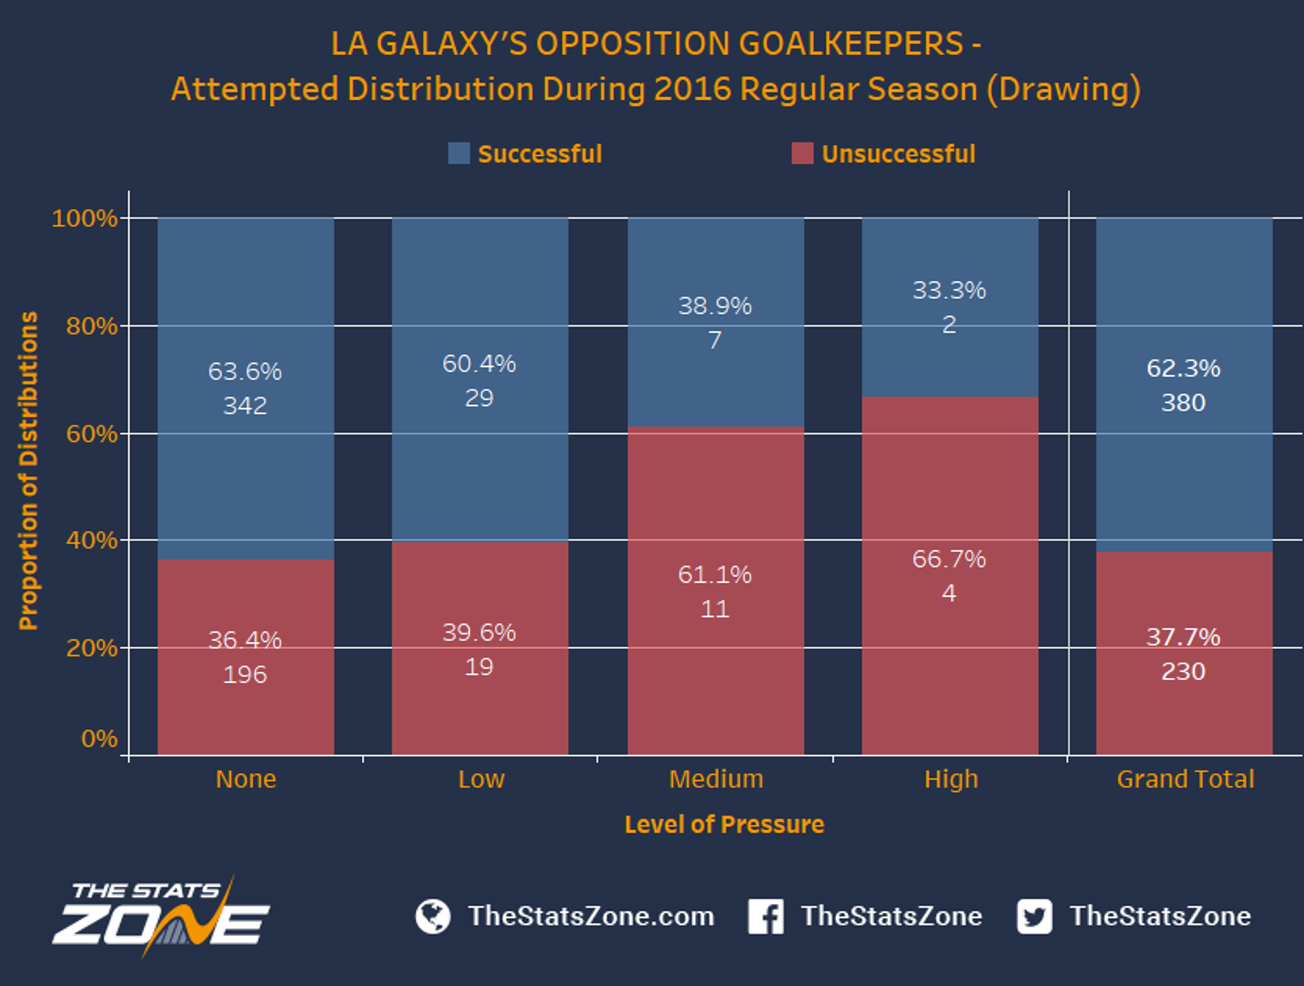
This graph is a little more aligned with what one would expect, as the success rate tails off as the pressure is increased. It is worth noting however, that the number of observations in the medium and high category is relatively small. The total success rate of 62.3% is significantly higher than the previous graph (54.5%). As with our previous article, this is likely to be down to the fact that LA Galaxy give their opponents the chance to play the ball short to defenders while drawing, as they are not chasing the game and can afford to be more cautious in their approach. This is an aspect we will investigate later in the article.
To complete this section of the analysis, we’ll move on to the distribution success rate when LA Galaxy’s opponents were losing (LA Galaxy winning):
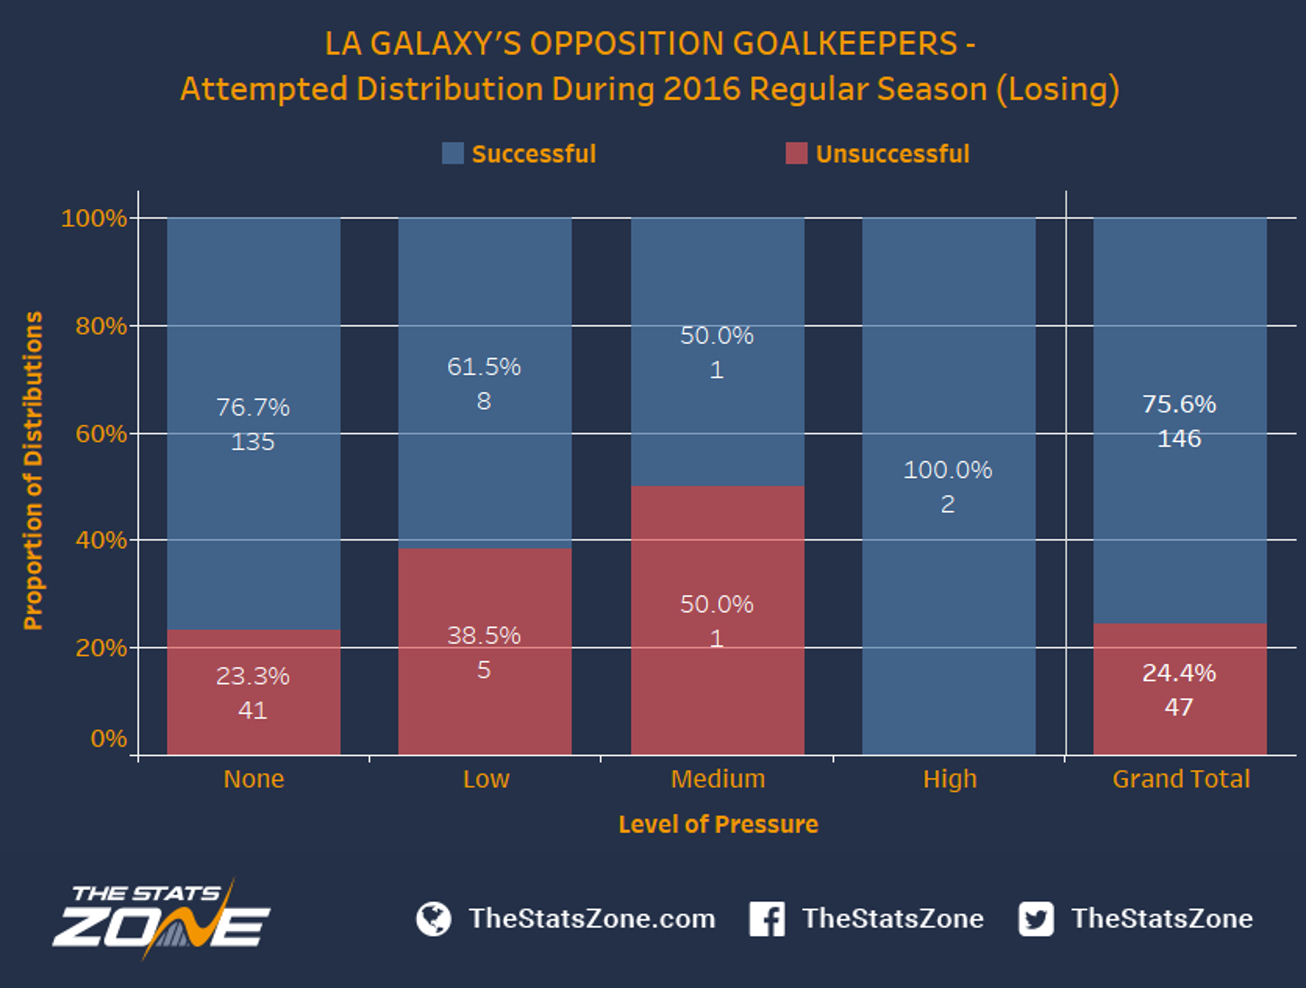
The graph yet again shows a decreasing success rate as more pressure is applied, with exception to the high pressure level where they have a 100% record of success. Having said this, the number within the bar shows that it only consists of two observations, making it very hard to draw any strong conclusions with such a limited sample. The total distribution success rate of 75.6% is the highest out of all three game states, which suggests that, as we previously mentioned, when LA Galaxy are winning they generally put less pressure on the opposition goalkeeper, resulting in a better success rate for their opponents.
Our next focus is the distribution target; essentially, this is who the goalkeeper chose to pass the ball to. Again, we start with the scenario when LA Galaxy’s opponents were in the lead:
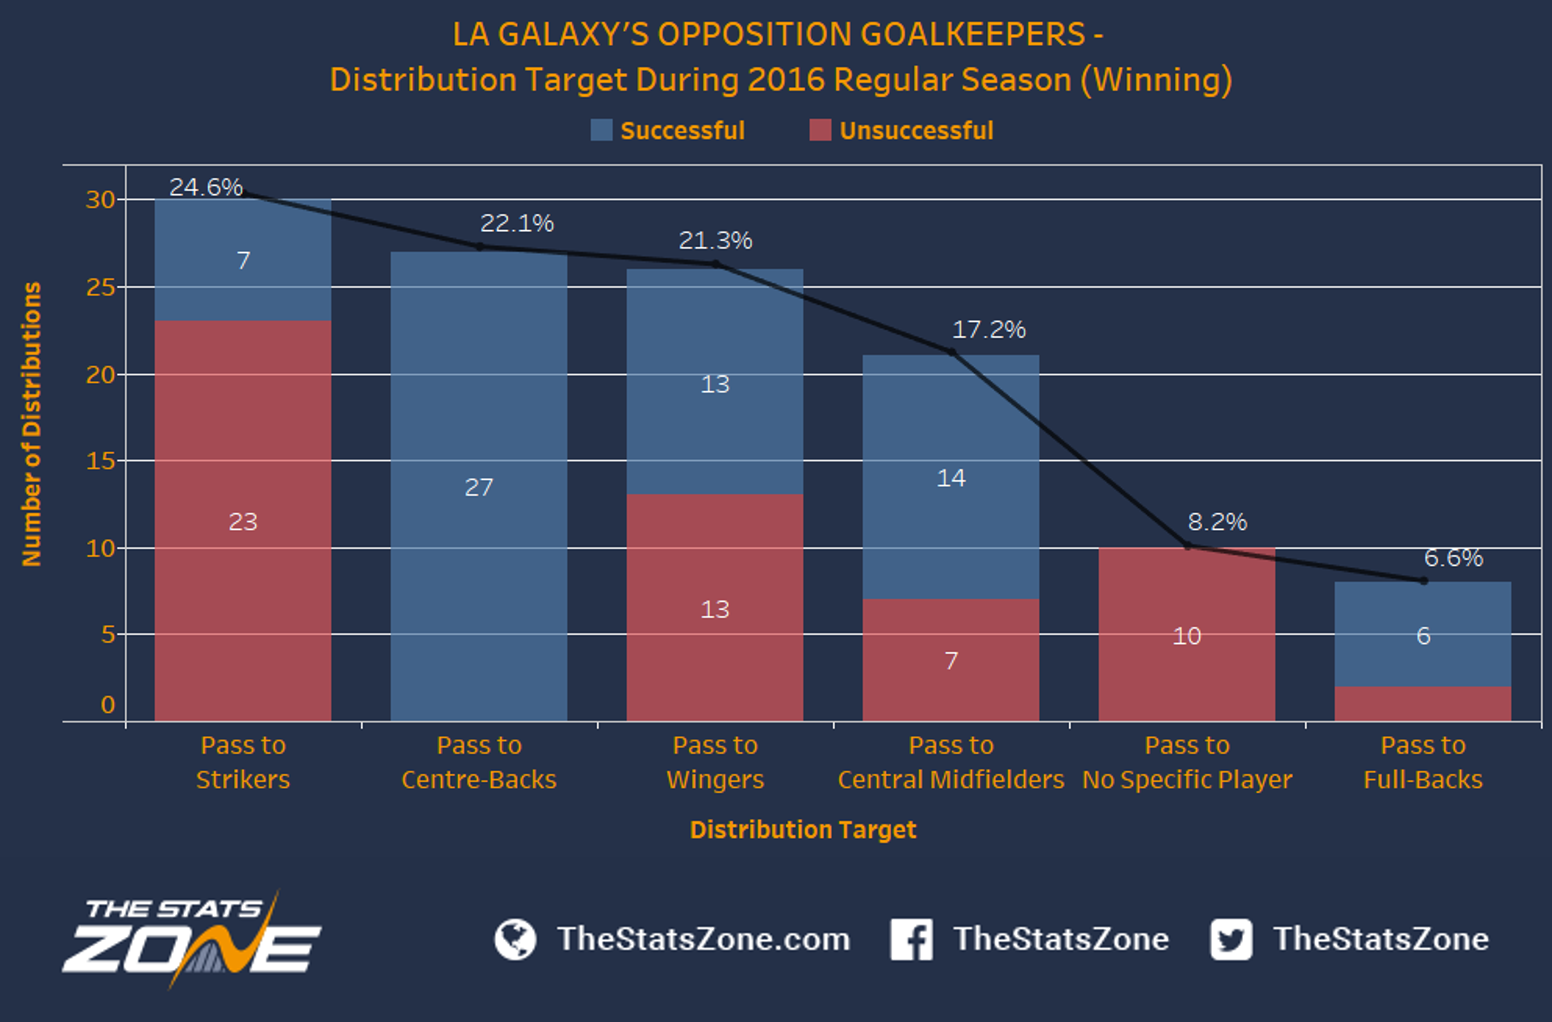
The distribution targets when LA Galaxy’s opponents were in the lead are quite evenly shared between the four first groups, ranging between 17.2% and 24.6%, with a pass to full-backs being a very rare occurrence. Before we move on, it is worth noting that the record for passing the ball to centre-backs is perfect, with all aimed passes reaching their target.
The graph below, which looks at the distribution targets when the game is at a draw, shows a very similar shape to the previous graph:
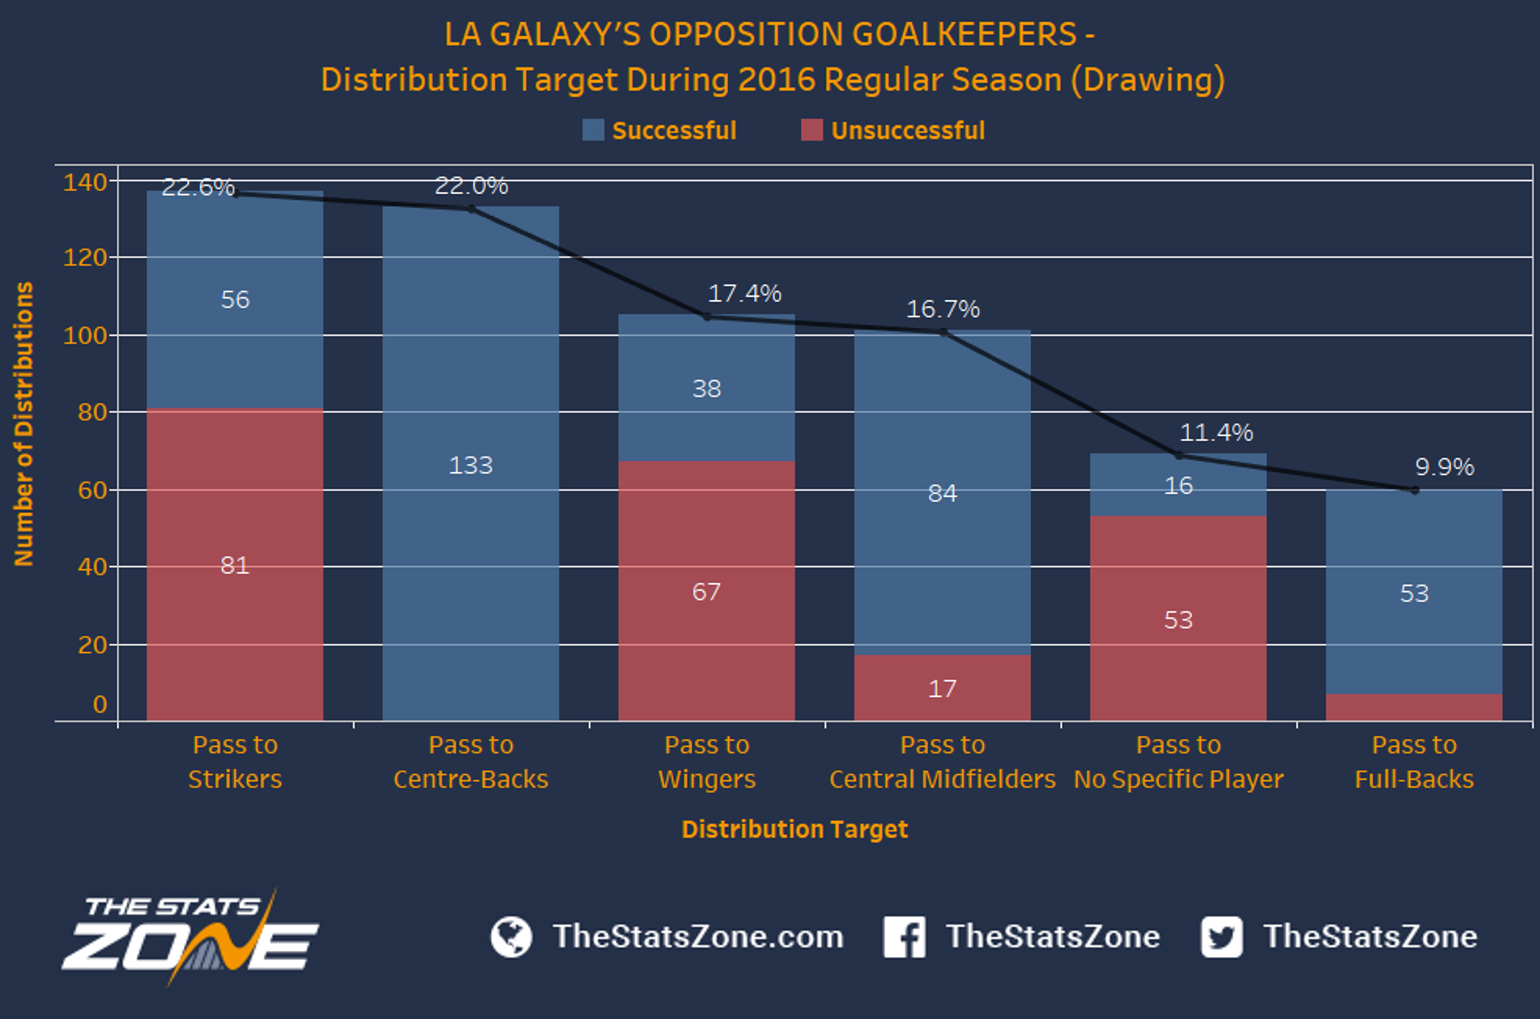
Passing to strikers was still the most common way of distributing the ball, closely followed by passing to centre-backs with a combined proportion of distributions at 44.6% (22.6%-22.0%). Looking closer at the ‘pass to strikers’ category, we can see that 41% (56) of distributions were successful, sitting significantly higher compared to their score while winning in the previous graph, which was 23% (seven out of 30). Once again, there were no mistakes when goalkeepers chose to pass to centre-backs.
The final graph of this section looks at the distribution target when LA Galaxy’s opponents were losing, and the results are noticeably different:
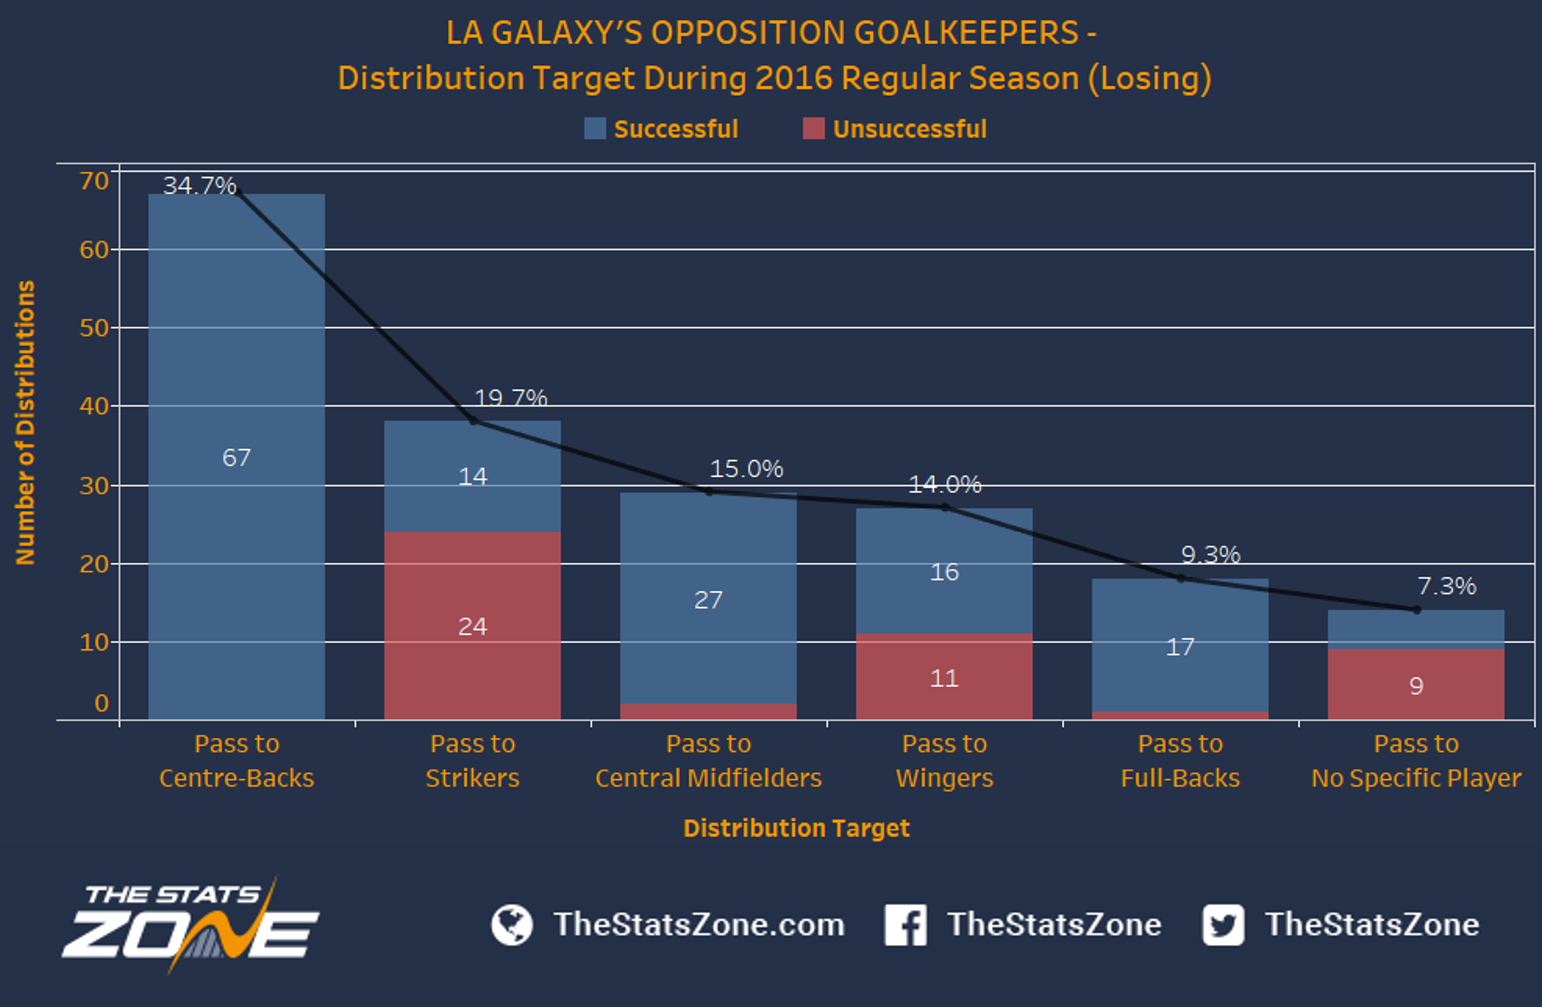
The graph shows a heavy skew towards passing to centre-backs (perfect record), which accounts for 34.7% of all distributions. Therefore, it seems that LA Galaxy let their opponents pass the ball to centre-backs when they are winning (opponents losing). This is likely to be a result of LA Galaxy reverting back, trying to look after the lead rather than moving forward and adopting high defensive pressure.
So, how does the type of distribution differ between the varying game states?
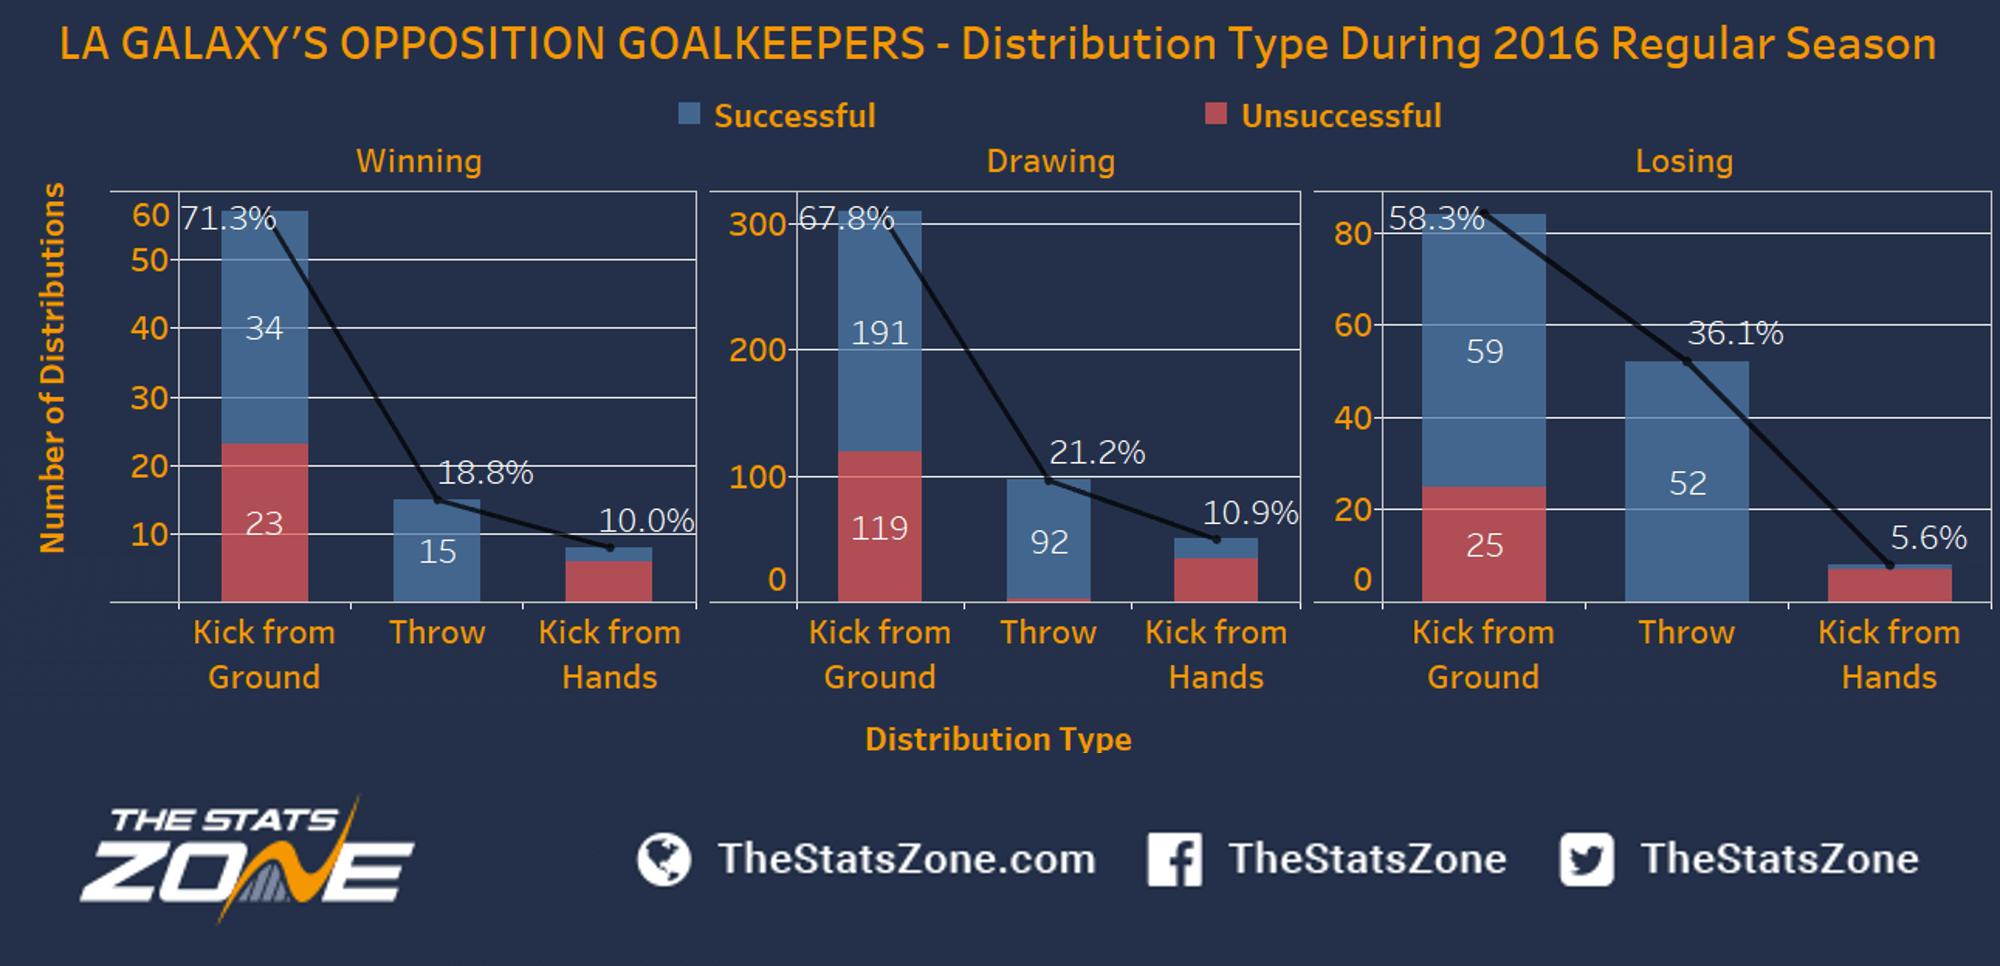
We can see that a kick from the ground was the preferred way of distributing the ball regardless of the score-line in the game. However, the preference to kick the ball from the ground seems to be slightly higher when winning or drawing the game. The goalkeepers did not often kick the balls from their hands, and when doing so we can see that the red bar is significantly higher when winning or drawing, suggesting that this was an ineffective distribution type if the aim was to remain in possession. Clearly, managers may want to discourage this type of distribution if they prefer a possession-based game.
As part of our analysis into LA Galaxy's opposition goalkeepers, we looked at the occasions where Galaxy players made attempts on goal throughout the 2016 regular season. We collected data on what section of the goal they aimed their shots, and where the conversion rate was the highest. This is represented in two separate graphics which illustrate shots and goals, and allows us to see where the goalkeepers most often saved goal attempts.
First, we look at the shot distribution:
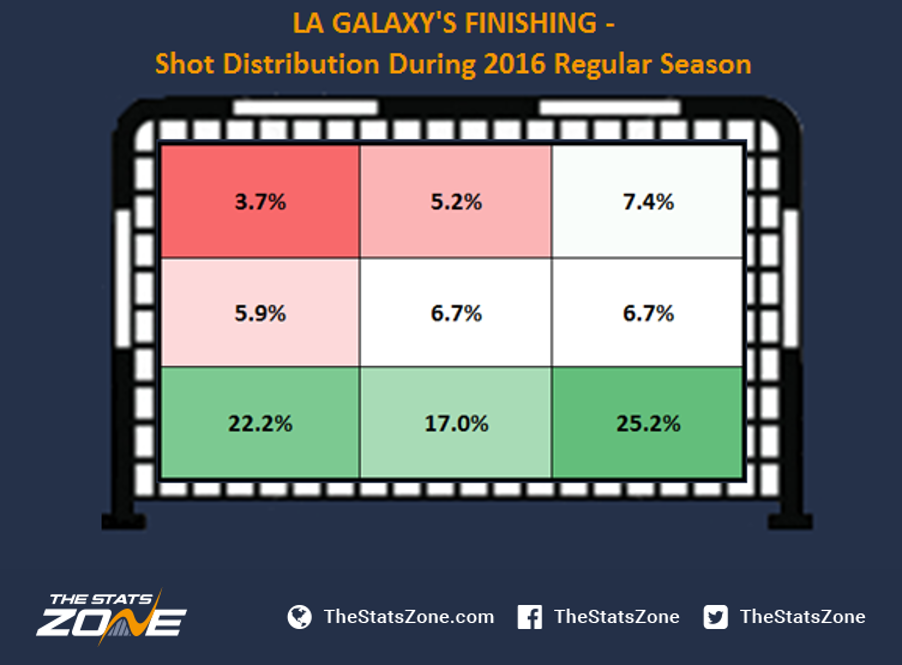
Almost two thirds (64.4%) of the shots were taken in the lower parts of the goal. The middle part of the goal is the next favourite, with a proportion of shots ranging between 5.9% and 6.7%. When looking at the top of the goal we can see that most shots were taken in the top right corner at 7.4%.
We’ll now see how this graphic looks when we account for goals only:
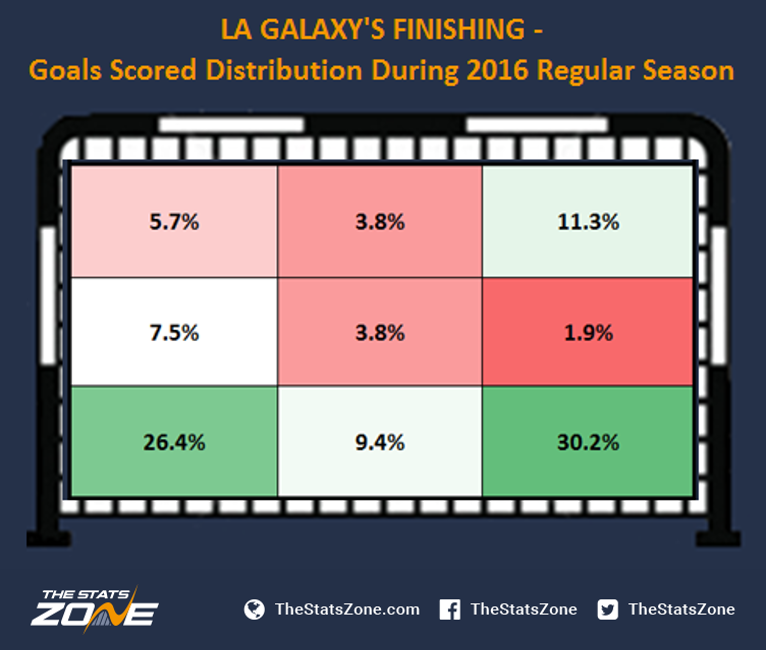
The graphic shows that the vast majority of goals were conceded in the lower corners, with the bottom right yielding the highest rate at 30.2% followed by the bottom left at 26.4%. If we compare this to the previous graph, it makes sense that most goals were scored in this part of the goal as most shots were aimed at this area. Another observation is that 11.3% of all goals were scored in the top right corner (5.7% in top left corner). This is actually higher than the proportion of shots taken in this part of the goal. It is generally more difficult to aim in this part of the goal, but it is also more difficult to save the successful attempts. This naturally translates into a better conversion rate for shots places in the top corner.
This study showed that, on average, the success rate for goalkeepers’ distribution to their teammates is higher when losing or drawing the game. In terms of the distribution target, we have seen that when LA Galaxy’s opposition are either winning or drawing the game, they prefer to distribute the ball to strikers closely followed by centre-backs. Furthermore, if LA Galaxy want to regain possession, they should try to stop their opponents passing the ball to the centre backs as it showed a perfect success rate, regardless of the score in the game. The distribution type showed that LA Galaxy should be happy to let their opponents kick from the ground (most common way of distributing the ball) as the accuracy for this is significantly worse compared to throwing it from the hands. The shots taken and areas of the goal where most goals are scored are very similar to our previous piece, suggesting that shots in the top corners might be harder and rarer but also with a higher conversion rate.
For our previous statistical studies into LA Galaxy’s 2016 regular season, visit the following links:
In-Depth Statistical Analysis Of LA Galaxy’s Goalkeepers In The 2016 Season - http://www.thestatszone.com/articles/in-depth-statistical-analysis-of-la-galaxys-goalkeepers-in-the-2016-mls-season
In-Depth Statistical Analysis Of LA Galaxy’s Designated Players In The 2016 Season - http://www.thestatszone.com/articles/in-depth-statistical-analysis-of-la-galaxys-designated-players-2016-mls-season
In-Depth Analysis Of LA Galaxy’s Chance Creation In The 2016 Season - http://www.thestatszone.com/articles/in-depth-analysis-of-la-galaxys-chance-creation-in-the-2016-mls-season
The Stats Zone provides bespoke services for some of the leading teams, associations and confederations in world football. This analysis on the LA Galaxy was part of an internal study and not used in a commercial sense. Please do not hesitate to get in touch with us through our ‘Contact’ page - http://www.thestatszone.com/contact if you would like to discuss any bespoke research projects for your organisation.


