How Competitive Are The Top Five European Leagues?
The methodologies used when analysing competitive balance are a subject of wider discussion and is utilised between and within leagues in several sports. Whilst most of the analysis on this subject looks into the difference between the strongest teams in relation to the others, TSZ decided to analyse the competitive balance between all clubs in the top five European football leagues since the 1997/1998 season.
In order to measure the competitiveness between all the clubs in a league between several seasons, this analysis applies a ratio from 0 to 1, where 0 is the most balanced possible outcome (all clubs end the season with the same number of points) and 1 is the most imbalanced outcome (six points separate each club from one another, which would be the case if first place wins every match, second place wins all matches apart for losing both games against the strongest club, and so on until we get to the weakest club who lose all their games).
The ratio is calculated by dividing the sum of the points difference between all clubs by the total number of possible points that a club can achieve. For instance, in the Premier League a club plays 38 games and can achieve a maximum of 114 points, so taking the 2015/2016 season as an example, the sum of points difference between all clubs was 64 points (Leicester – 81, Aston Villa – 17), thus the ratio is 64/114 = 0.561.
The sample is composed of the top five European Leagues since the 1997/98 season. According to the table below, it is clear that on average the most imbalanced league is Serie A, marginally followed by the Premier League. Both leagues have ratios above 0.5, which indicates that they are closer to the perfect imbalance than the perfect balance. On the other hand, La Liga and Bundesliga have identical scores and toe the line between the trend of balance and imbalance. Finally, Ligue 1 is the most balanced league we studied, with a score of 0.447 being the closest league to a perfect balance:
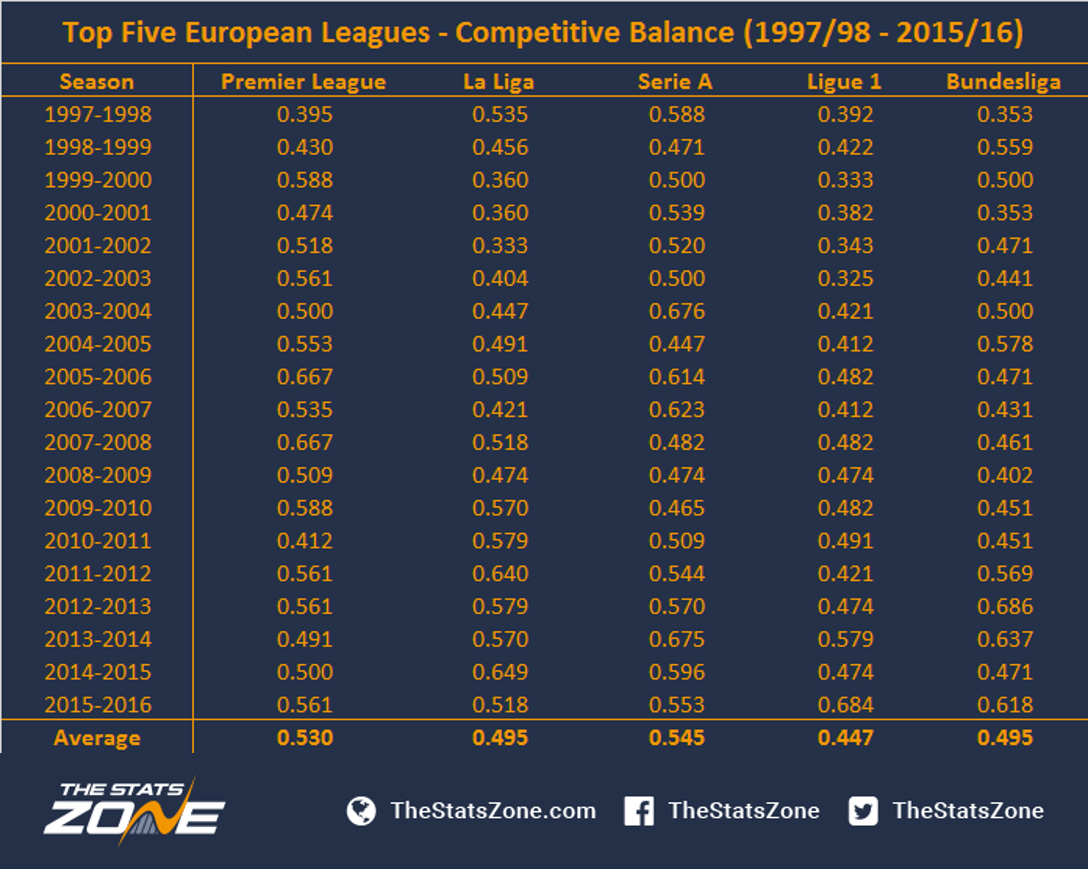
To pick out some examples, the 2002/2003 Ligue 1 season was the most balanced with a ratio of 0.325. In that season, the French league shifted the number of clubs from 18 to 20, and Olympique Lyonnais won their second title in a row, finishing just one point ahead of second place and six points ahead of seventh place:

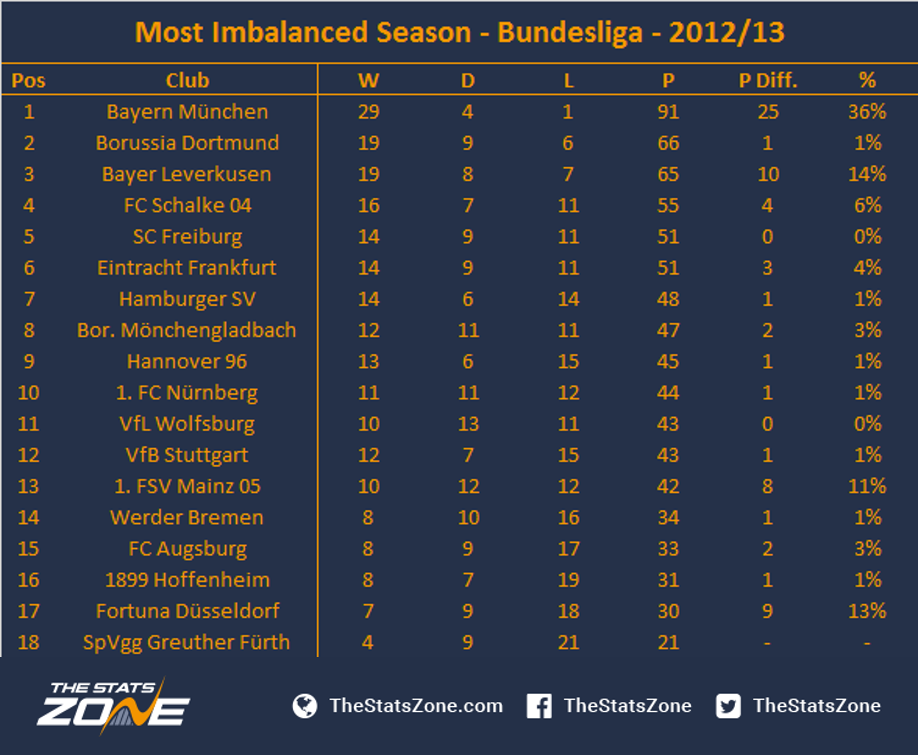
On the other hand, the most imbalanced was the 2012/2013 Bundesliga campaign with a ratio of 0.686, when Bayern Munich dominated and finished the season an incredible 25 points ahead of second place, which represented 36% of the points difference between all clubs in that season. As a result, Bayern achieved the most number of points in a season in Bundesliga history (91 points):
As we reflect once more on our first table, we should point out that going all the way back to the late 90’s means that these averages may not be so relevant today. As an example, last season Ligue 1 was the most imbalanced league, yet their overall average is the most balanced. Similarly, the most imbalanced league overall, Serie A, was the second most balanced league in 2015/2016. So, in order to identify the current state of these leagues and their trends, the analysis split the whole sample into four time periods:
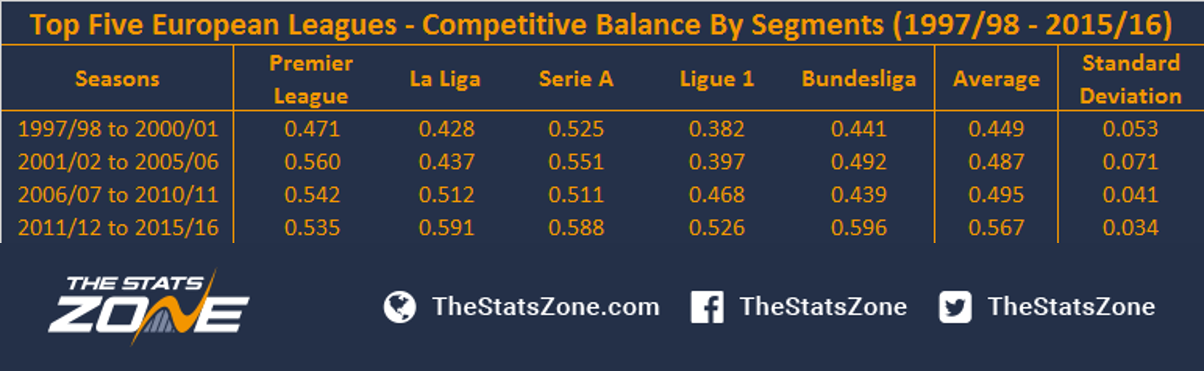
The table shows that, if you average all five leagues, they were most balanced in the earliest period (1997/1998 to 2000/2001), with only Serie A having a ratio above 0.5. On average, the leagues in the present day (2011/2012 to 2015/2016 season) are 26% more imbalanced than the earliest period in the study, showing a significant leap towards greater imbalance. Additionally, not only did the average jump from 0.495 to 0.567 since the third segment, but at the same time the smallest standard deviation is from the most recent period in the study, which indicates that apparently the leagues are becoming steady and close to each other in a range between 0.5 and 0.6.
Looking deeper into this breakdown, we will split the league into four quarters - 'top', 'top middle', 'bottom middle' and 'bottom'. Here we look at the four quarters’ average percentage of the league table’s ratio share, with the graphs showing dissimilar trends and key points between the top five European football leagues:
Premier League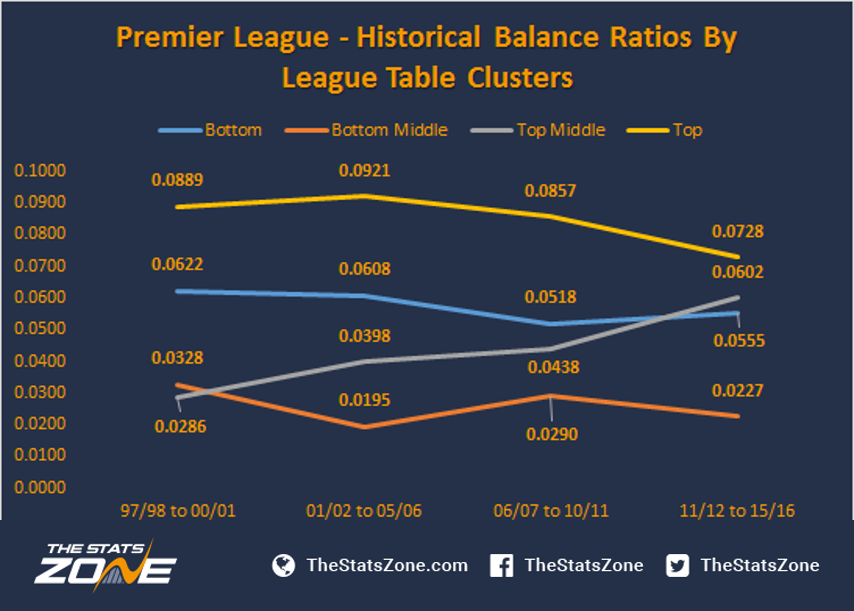
- There is an increase in balance within the top five clubs ('top), but at the same time this cluster is still the most imbalanced quarter of the league.
- The second most imbalanced quarter of the league used to be the bottom five clubs of the table. Therefore, the top middle table quarter became the second most imbalanced cluster over the last five seasons, indicating that the top half of the league is considerably more imbalanced than the bottom half.
- The bottom half of the table is by far the most balanced zone of the league.
La Liga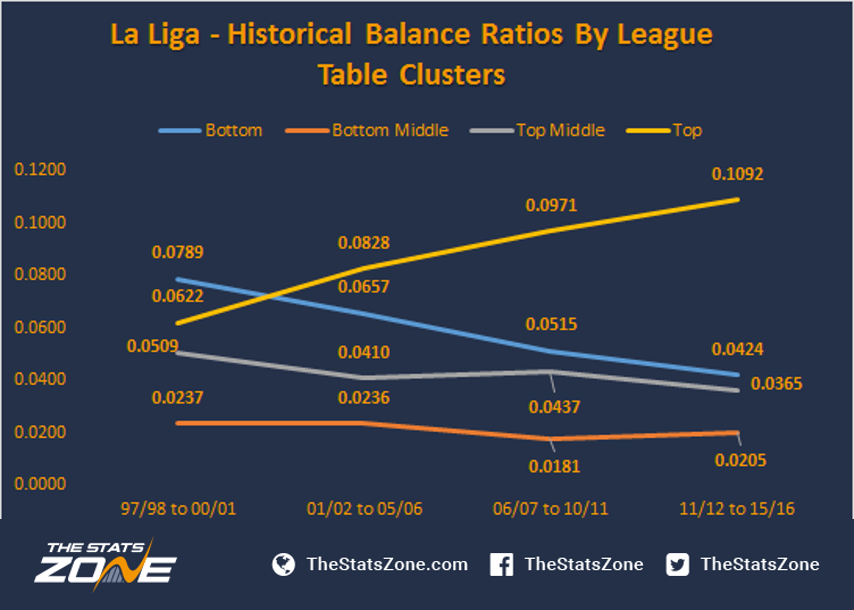
- In the first analysed period of La Liga (1997/1998 to 2000/2001), the bottom five clubs ('bottom') was the most imbalanced cluster of the league. It was a period where the points gap between the weaker clubs and the middle table used to be larger than the gap between the top clubs and the middle table. Nowadays, this scenario has completely changed on account of the increased domination of Real Madrid and Barcelona (and recently Atletico de Madrid).
- The top quarter of the league had a steady growth since the first period and now has an average higher than the sum of the average of the other three clusters. On the other hand, the weaker clubs became more competitive and their ratio has seen a steady decrease since the first period, and it is also getting close tor the other two middle table clusters.
Serie A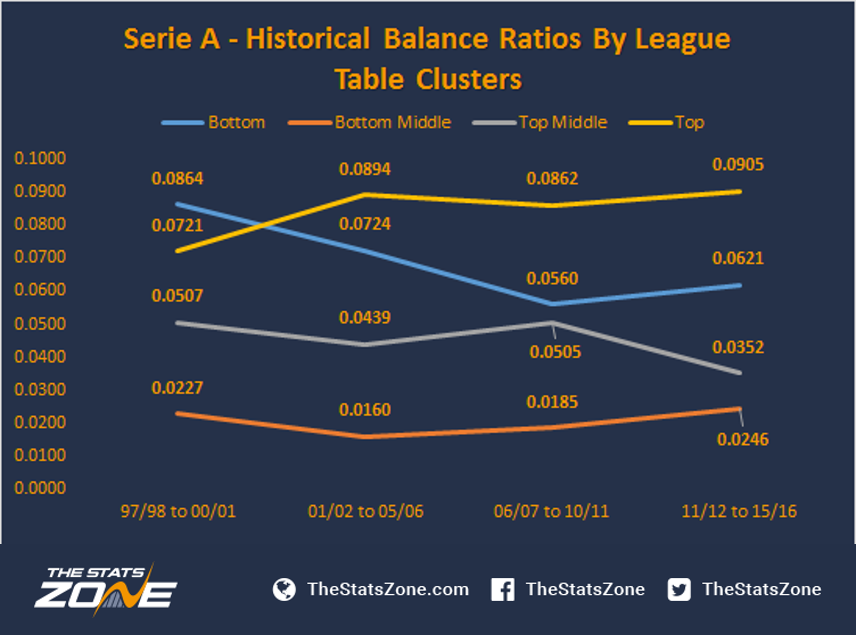
- The bottom clubs used to represent the most imbalanced zone of the league, but nowadays the top clubs shifted to the most imbalanced cluster. However, the ratios for both ends of the league are quite high over the period, indicating that the stronger clubs have been very strong and the weaker clubs have been very weak.
- The highest ratio of the league over the clusters and over the periods is as a result of the recent Juventus domination era, where the club not only won the league in all editions of the last period but also averaged 16% of the points difference since 2011/2012.
Ligue 1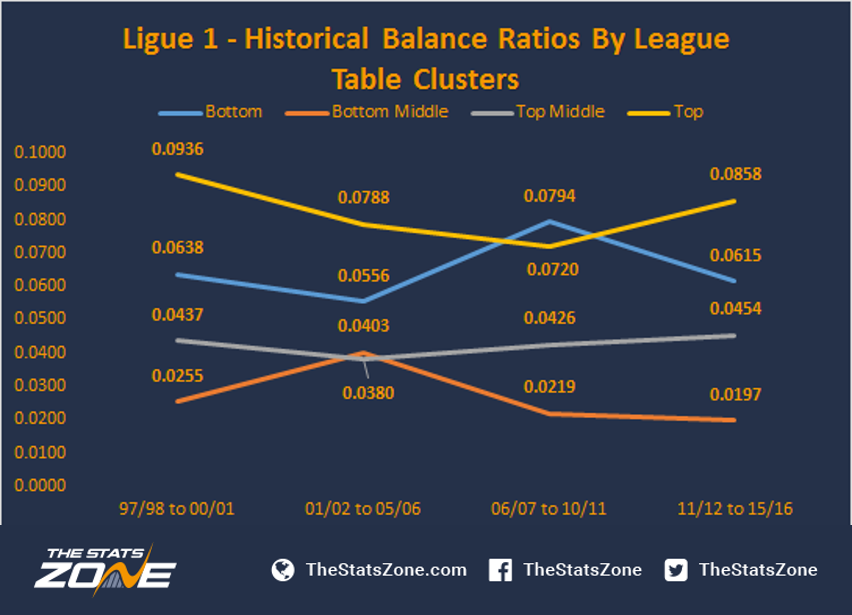
- Unlike the other leagues, the bottom of the table became the most imbalanced cluster of the league between 2006/2007 and 2010/2011, especially due to the increase of competitiveness at the top of the league before that period. Therefore, the introduction of PSG as a dominant force brought a new scenario to the league and shifted the downward trend to an upward trend. The club averaged 20% of the points difference within the last period and has a considerable weight on the recent growth of the ratio, leading the French league to a more imbalanced state.
- While the bottom half of the table is on a downward trend, the top half of the table is on an upward trend, indicating an increase in competitiveness between the weaker clubs and a decrease of competitiveness between the stronger clubs.
Bundesliga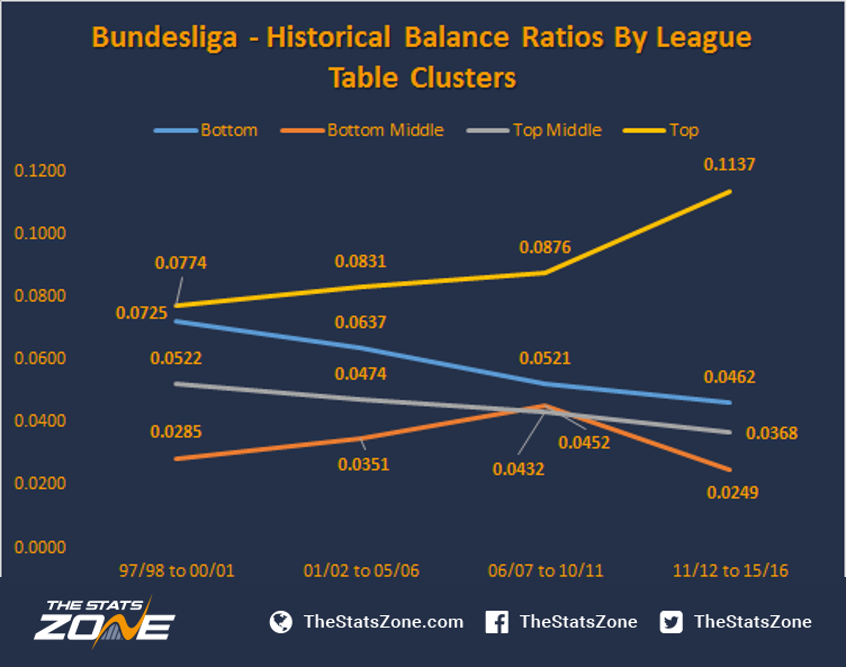
- There is a considerable shift in the top zone of the table, especially in the last period, where Bayern Munich’s superiority led the league to a more imbalanced state. The club had an average 23% of the points difference over the last period.
- On the contrary, all the other clusters not only became more balanced since the late 1990’s, but similarly to La Liga, the other clusters are also close to each other.
In summary, the results show that all the leagues are becoming more imbalanced in relation to the late 1990’s. Apart from the Premier League, the improvement in performance of such clubs as Real Madrid, Barcelona, Bayern Munich, Juventus and PSG in their national leagues over the last few years were the main cause of the increased imbalance in their respective domestic competitions; their relative superiority over other teams reduces the competitiveness in the top half of the table.
At the other end of the scale, the ‘weaker’ clubs have not only been more competitive in recent times, but the analysis also found that the most competitive quarter of the league table is the bottom lower section of mid-table.


