Goal Scoring Seasonality – Winter Versus Summer Leagues
The number of goals scored in a football game depends on an endless number of factors. This study investigates two of the main factors that affect the seasonality in terms of the number of goals scored, and how this may differ between summer and winter leagues.
The study is based on a data comparison between the top 5 European leagues, which play their season in the winter (English Premier League, German Bundesliga, Italian Serie A, Spanish Primera Division and French Ligue 1) and two Nordic leagues which operate in summer (Norwegian Tippeligaen and Swedish Allsvenskan). The data set contains goals scored during the last 5 seasons. For winter leagues it includes 4 full seasons and all games played before 2016-02-08 of this season (2015/16).
There were a number of considerations in this analysis. Firstly, since the leagues have different formats, I have split each leagues’ season into 10 parts (10% each) to enable a clear comparison of average goals scored in each period. Secondly, the study takes into account that in different leagues, the international fixtures are played at different times relatively. Finally, the goal scoring averages have been added for the final round, to enable consideration of the increase of goals scored when titles are won, European places settled and relegation is decided.
It is fair to assume that when pitches are in their best condition, the average number of goals scored in a football game would increase. It is particularly interesting to consider pitch conditions which peak approximately half way through the season in the summer leagues in contrast to December/January pitches in the winter leagues.
Another influencing factor is the importance of specific games, for example if there is a game between two title contenders or two teams fighting against relegation, it is more likely to be a low scoring affair than a fixture between teams that have nothing to play for.

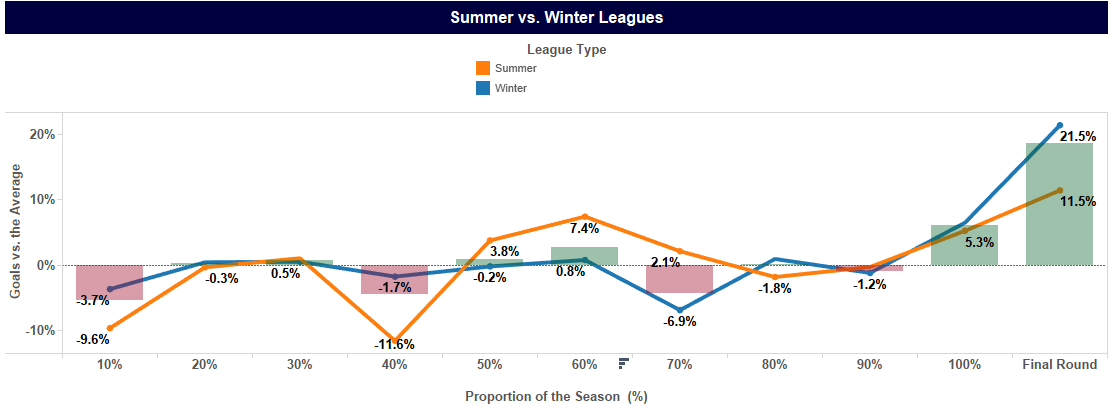
The upper graph in the dashboard splits winter vs. summer leagues and shows whether the average percentage of goals scored in a given period is below or above the season league type average (normalised to 0). The bar graphs within illustrate the total average for both summer and winter leagues and whether the total number of goals scored in a certain period is higher or lower than this average. For example, if the average number of goals scored after 20% of the season in a summer league was 2.75 and the joint average for summer leagues over 5 season was 2.75, the line graph for 20% would sit at 0%.

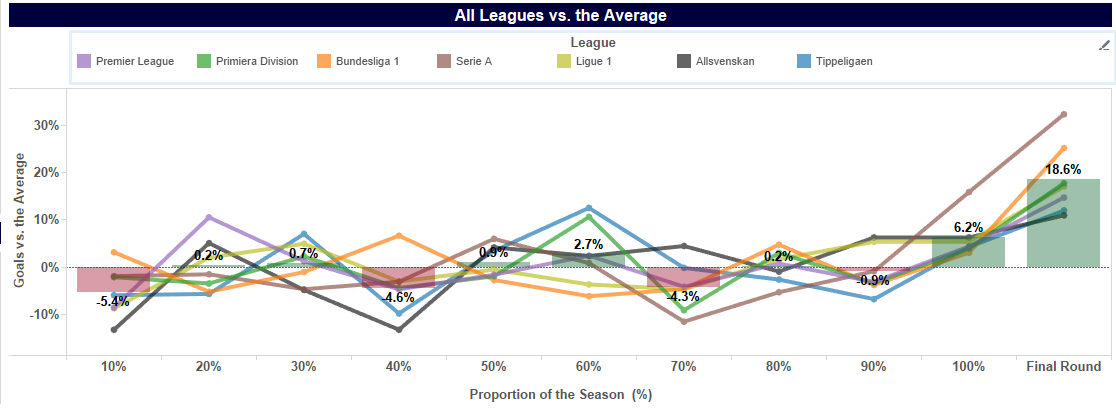
This graph follows the same structure but splits out each of the leagues in the study in order to compare if a league is scoring above or below the average at any given point in the season.
Looking at the top line graph, there is a significant difference between winter and summer leagues noticeable through 40%-70% of the season. The line graph at 40% on vertical axis for summer leagues shows that the average number of goals scored for the period is 11.6% below the average compared to the same measure for winter leagues sitting at 1.7% below the average. A closer look at the raw data for this period shows that summer leagues prior this point stop for international fixtures, Euro Championship and World Cup. When they restart the league again we see a similar effect as in the beginning of the season with a lower number of goals scored compared to the average.
Moving on, looking at the data between 50-70% of the season played, summer leagues’ average goal score is significantly higher than for winter leagues and ranges between 2.1%-7.4% above the average. At this time pitches are significantly better compared to the top European leagues. It’s therefore reason to conclude that pitch conditions play part in the number of goals scored.
The summer and winter leagues behave similarly from 80%-100%, with the average goals scored in the final round being 21.5% higher for winter leagues and 11.5% for summer leagues. A closer look at the lower graph shows that the main impact for winter leagues in the last round comes from Serie A and Ligue 1, scoring 32.0% and 25.1% respectively above the average.
Interestingly, Bundesliga 1 provides some slight anomalies in this hypothesis. The lower graph demonstrates how Bundesliga 1 is the only league which scores above the average at 10% (3.1% above) and again at 40% (6.7%) into the season. At these points one would assume, as the other four winter leagues demonstrate, that the goal score figure would be lower due to early season matches (10%) and poor pitch conditions (40%).
Furthermore, Bundesliga also scores the least goals compared to the average at 50% and 60% of the season. This could relate to pitch conditions which would be at their worst this far into the season. However, it is more likely to be down to the fact that Bundesliga is the only league that takes a full winter break, and it takes time before the goal scoring levels return to the average when the league restarts.
To conclude, the analysis demonstrates that pitch condition has an impact on the number of goals scored. Summer leagues show a greater average in the peak months between June-August compared to December-January fixtures in the winter leagues. Furthermore, meaningless games and the last round of fixtures see a higher number of goals scored regardless of the league in question. It would be interesting to carry out a related sub study looking into the data which seems to show that the number of goals diminishes after international fixtures and competitions.


