FA Cup Third Round – All You Need To Know
The Saturday of the third round in the FA Cup is a special day for football fans across England. It’s commonly recognised as the day that the competition starts to accelerate, with the top two tiers entering the competition. The clash of the lower league teams who have fought their way through the qualifying stages and those entering at the top level often leads to exciting and sometimes unpredictable results. So, what does the draw look like this year? Is there reason to believe that there will be more shocks than normal? And how many Premier League and Championship sides can we expect to see being knocked out at the first hurdle? As a follow up piece to the first round proper, TSZ has decided to take a deep dive into the historical data (since 2007-08) of the third round of the FA Cup to see what we can expect this year.
Breakdown of the draw
First let’s take a look at the draw. The ‘third round proper’ contains a total of 64 clubs – 20 teams from the Premier League, 24 from the Championship and the remaining 20 from lower leagues (including five non-league clubs), leading to a total of 32 ties.
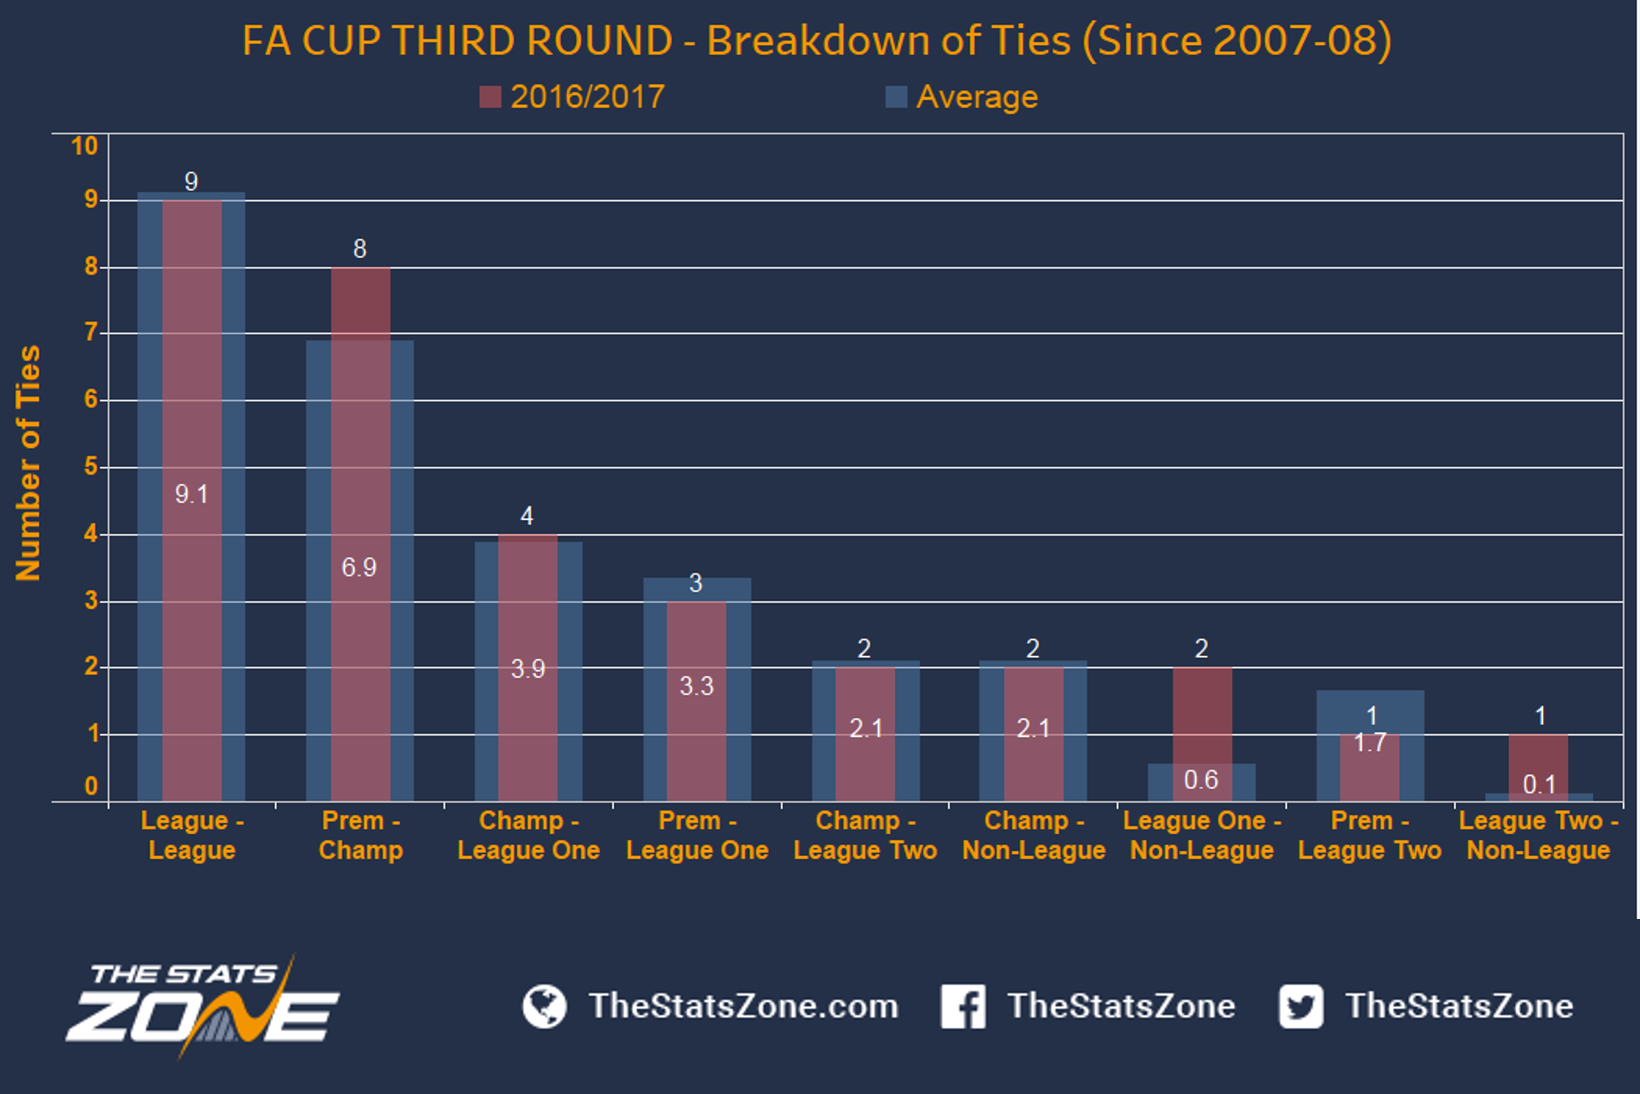
In the first graph we can see this year’s draw (red) against the average (blue) to see the comparative proportion of ties between the different leagues. There is a number at the top of each bar showing this year’s ties, with the number in the middle showing the average (since 2007-08). For both measures, the biggest groups are naturally League-League followed by EPL-Championship as they account for the largest number of teams.
We can see that this year, the number of League-League ties sits at nine, which is fairly in line with the average of 9.1. The second most common draw was EPL-Championship, and this year there are eight ties, 1.1 above the average at 6.9. It’s also interesting to see that this year, League One-Non-League and League Two-Non-League sit well above the average at two (average 0.6) and one (0.1) respectively. However, the matches are not all that even as the Non-League clubs have also been drawn against Championship sides twice (2.1). This suggests that for 2016-17, the Non-League clubs have had a reasonably good draw vs. the average as they are playing clubs from the two lowest professional tiers in more than half of the cases. It’s also worth noting that throughout the period of the study, there wasn’t a single instance of Non-League sides playing each other in the third round.
Moving on, let’s consider in more detail the number of tiers between the two teams in each draw. From the second graph we can see that the most common draw is between teams with just one league difference (a total of 12 games). This year there are no ties with a league level difference of four or more, and there are just four ties with three league levels difference. It’s also worth pointing out that this year; there are seven ties where the tier difference is two, which is above the average of 6.0.
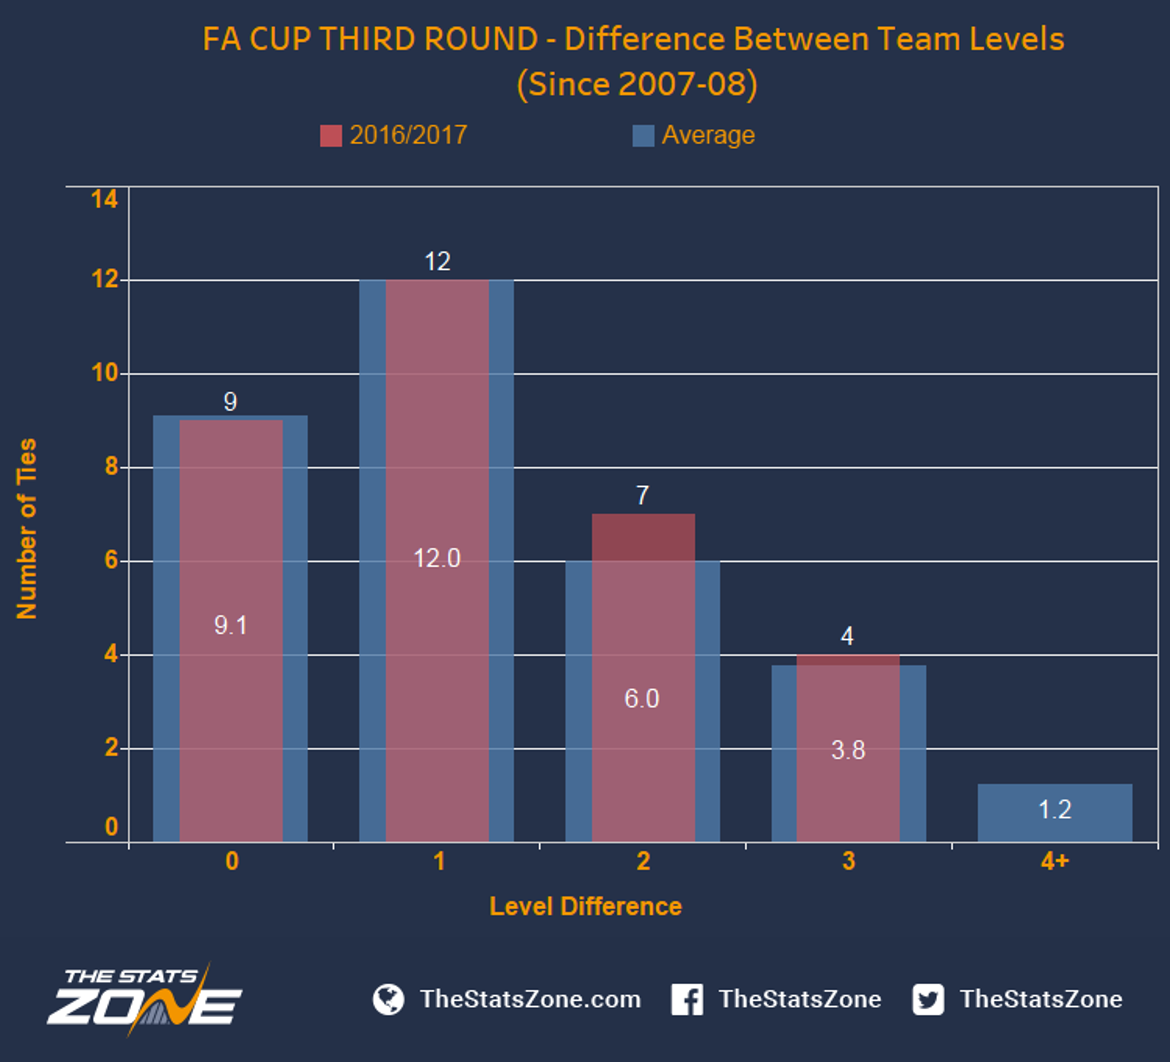
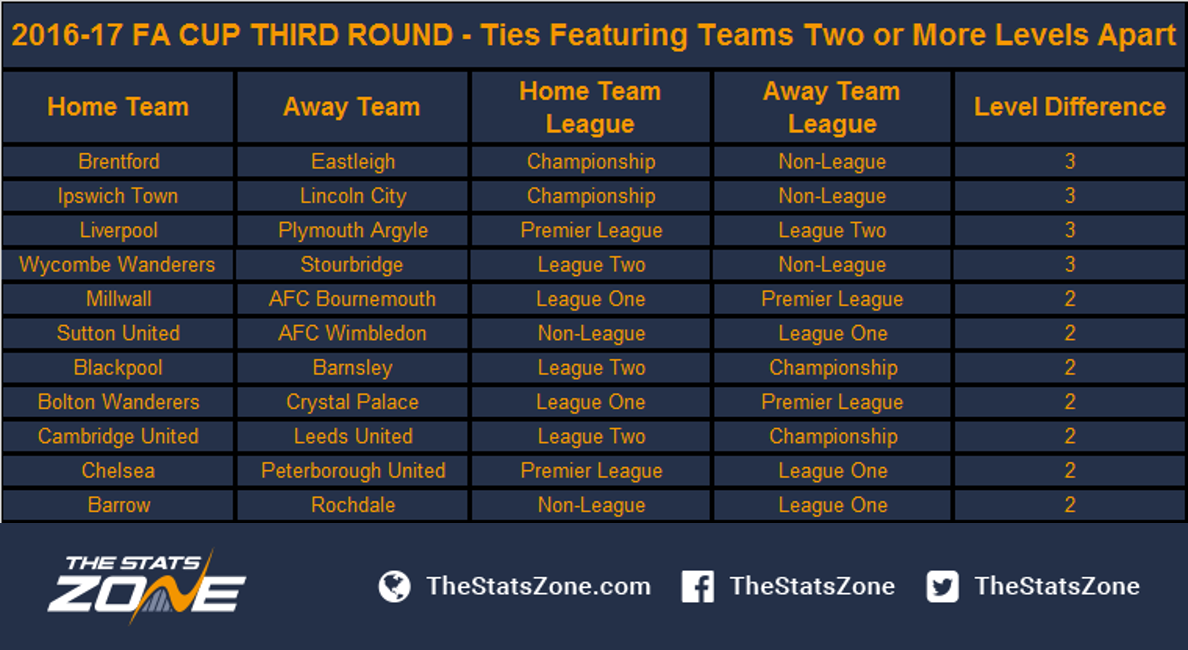
From the previous graph, we can see that the total number of draws with >two levels difference is eleven (made up of seven with a two level difference and four with a three level difference). Out of the eleven aforementioned draws, five consist of Non-League teams, leading to the potential for "giant killings" (which we define as when a Non-League team beats a team from the Premier League, Championship, League One or League Two). Let’s look at this in more detail;
Shock Results
From the graph below we can see that the number of shock results (any team beating a higher level team) increases in years where the number of ties with one level league difference increases and the number of same league ties decreases (i.e. zero level league difference). There are 12 ties with one league difference (matching the average of 12) and nine ties with zero league difference vs. average of 9.1. Therefore, based on the draw for 2016-17, we predict five shock results this year, quite in line with the average at 4.9.

The pie chart below shows the proportion of shocks in the third round depending on teams’ relative league difference. 54% of all shocks have come from teams with one division difference followed by 29% from team’s two levels apart. Looking back at the table that featured the ties between teams that are two or more divisions apart, it doesn’t bode too well for the teams that are three divisions (or more) apart with only 17% of all shocks coming from these ties, although they may find some hope in that. So, do certain ties have a propensity to progress to the next round more than others?

Looking at the table below, we can see that 29% of shocks come from League One teams beating Championship outfits. Interestingly, the proportion of shocks from Championship vs. Premier League is the same as those involving League One teams at 16%. For our Non-League sides, we can see that the only giant killings they managed were against Championship or League One sides.

The upper graph below shows that the number of shocks peaked in 2007-08, with roughly 1/3 of all games resulting in an upset. 2009-10 was the only year when there were more shocks won away vs. those at home. When moving onto the lower graph (showing the proportion of shocks won at home vs. away), we can see a clear advantage playing at home with around 60% of all shocks happening on home turf. Therefore, it’s worth keeping an extra eye out for teams with the potential to deliver shock results when competing on their home grounds.

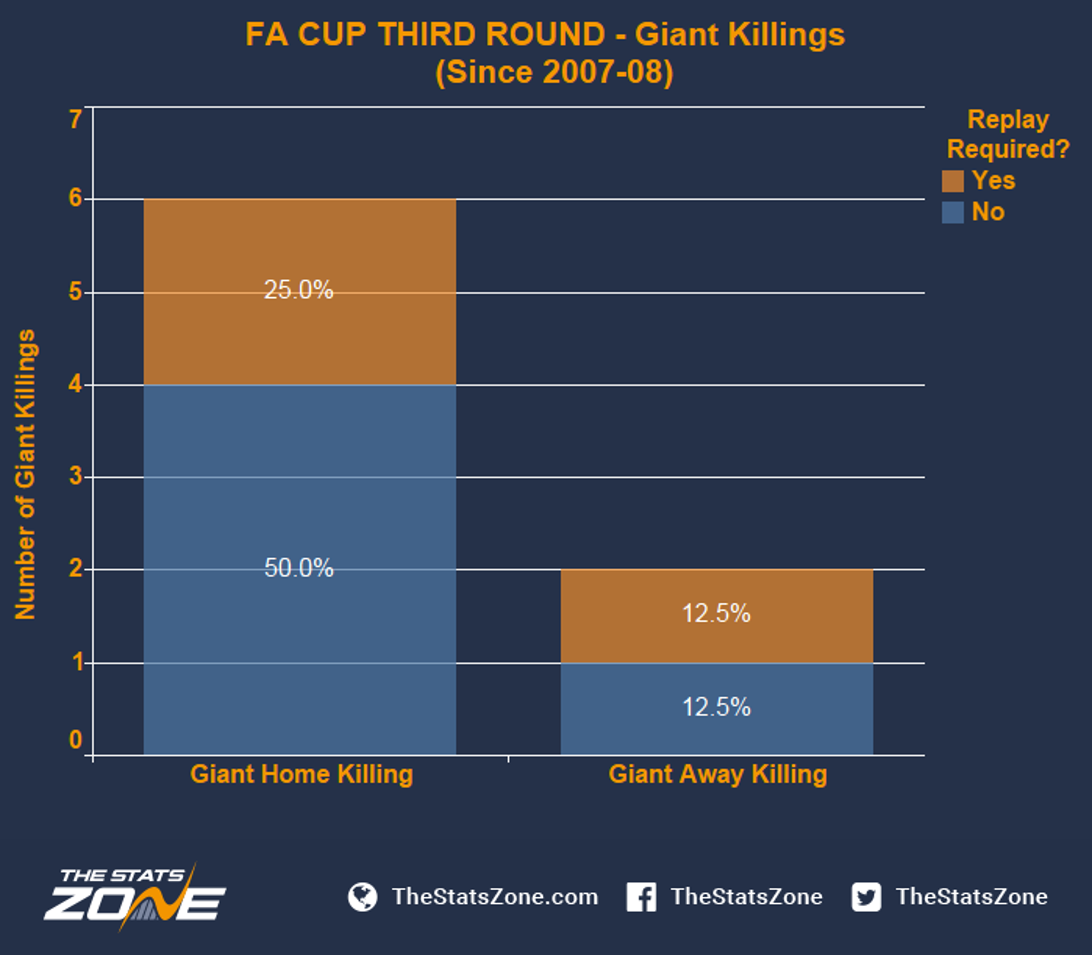
Looking specifically at giant killings, we get an even stronger home factor with 75% of all upsets achieved on home soil and a total of just two ties between 2007-08 and 2015-16 resulting in an away giant killing.
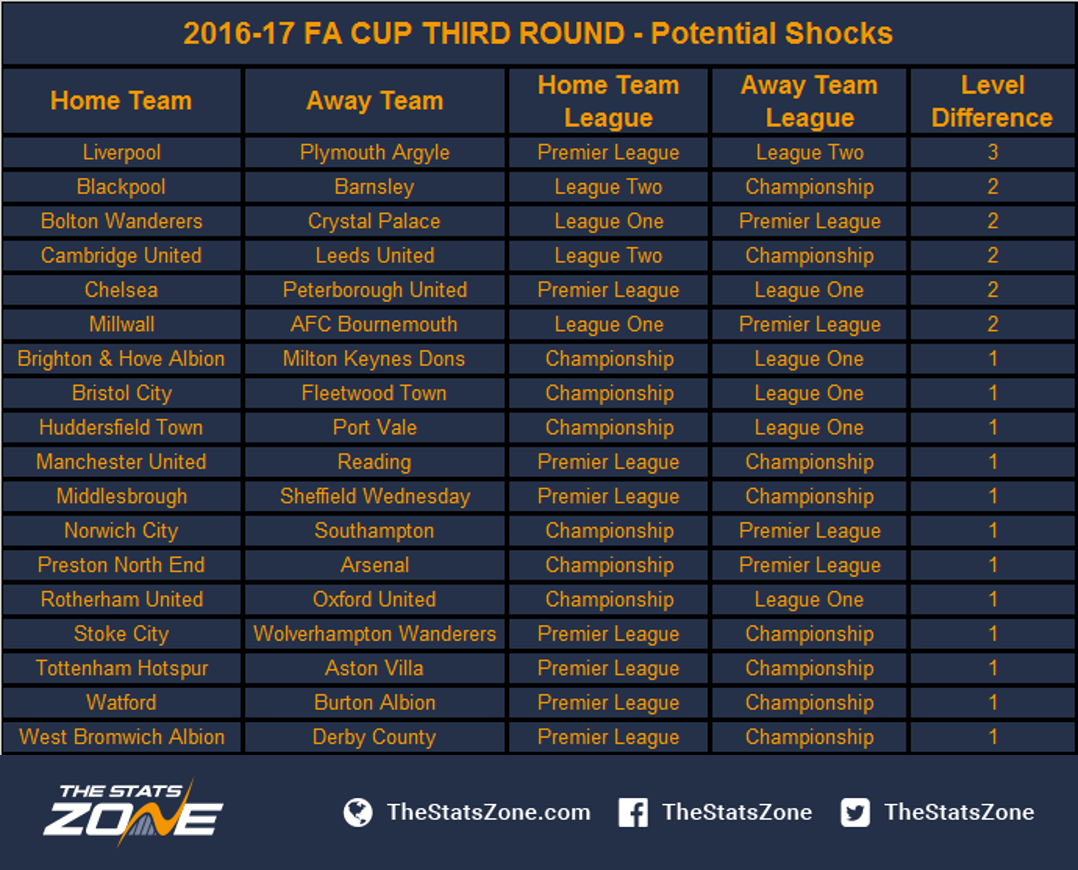
Given the data from these last few charts, the draws to look out for – in terms of likelihood for shock results – are;
And the ties with the chance of giant killings are;
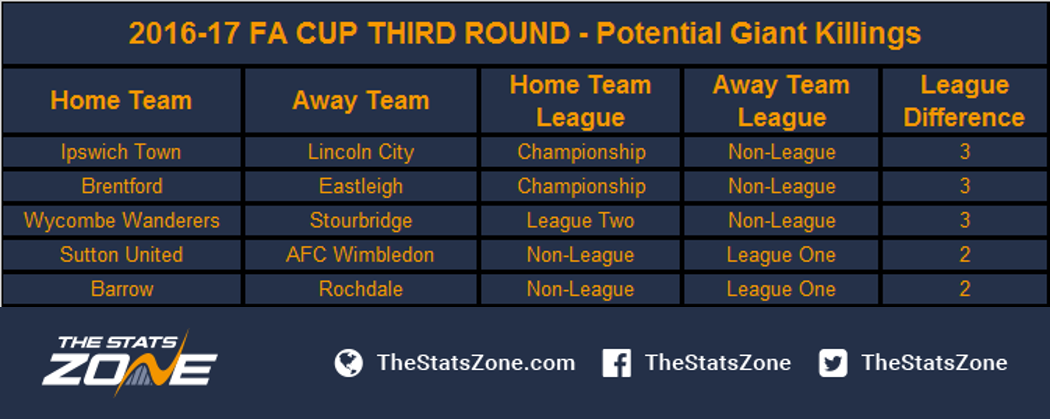
Seventh tier Stourbridge, who have enjoyed some fantastic runs FA Cup runs in recent years, are the lowest ranked team remaining in the competition; a victory away to League Two outfit Wycombe Wanderers would represent a monumental giant killing.
Progression
In the table below we can see that 76.3% of the teams that progress into the next round come from either the Premier League (44.4%) or the Championship (31.9%). Out of the Non-League sides, only 3.1% managed to progress since 2007/08. The lower graph shows us that the highest proportion of teams that progress, unsurprisingly, do so when playing at home, regardless of league. However, the home advantage is more apparent for lower leagues with League Two and Non-League teams seeing around 80% of their progressions from home.

Replays
Finally, we will take a look at the number of ties in recent seasons that have required a replay in order to settle the results. The top year was 2007-08, with a total of 37.5% of all games requiring a replay, 11.5% higher than the average of 26.0%.
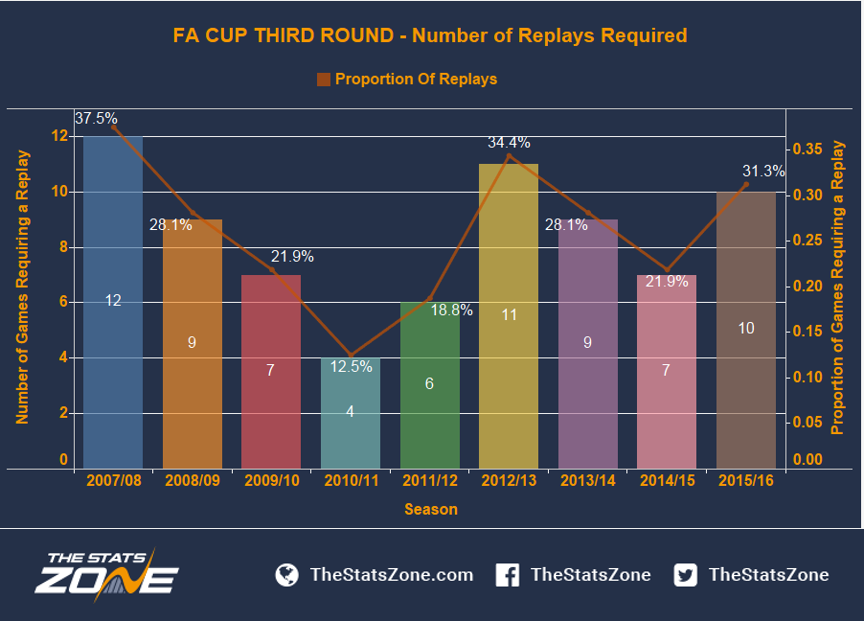
A closer look into the type of ties that result in a draw unsurprisingly finds League-League as the highest with proportion at 33.3%. Premier League–Championship and Championship-League One, both of which represent a one league level difference, follow this.

In this year’s draw, there are nine ties involving all League One clubs, so the likelihood of replays is strong there.
Conclusion
We have seen that most ties feature teams in the same league. Furthermore, the ties between teams from the same league lead to significantly more replays than any other type of tie. In terms of shock results, we have naturally seen that the majority of shocks come when the teams are one level apart in the league pyramid. Giant killings are not a common occurrence in this round for a number of reasons. Firstly, the Non-League teams would have had to get through a number of stages to get to this round and secondly they tend to come up against stronger opposition with the introduction of Premier League and Championship teams. Finally, it seems that playing at home is advantageous (as you would expect) in terms of progressing, even more so when we are looking at teams in League Two and Non-League.


