FA Cup First Round – All You Need To Know
With the first round proper of the FA Cup taking place this weekend, we have analysed the data from previous first round draws to see how this season’s draw compares. Have the non-league teams got a favourable draw? Will we see more shocks than normal? And how many non-league teams can we expect to progress to the next round? We take a look at all these questions and more.
Breakdown of the Draw
Firstly, let us take a look at the demographics of the draw. The first round proper contains 48 league clubs (24 from League One, 24 from League Two) and 32 clubs from the non-league pyramid.
The following graph shows how the breakdown of this year’s draw compares to previous seasons. On the whole it looks like the draw this year is favourable for non-league clubs. There are more plum ties for non-league clubs facing League One opposition as well as more all non-league ties, meaning we are guaranteed at least eight non-league clubs reaching the second round. When discussing previous seasons in this article, we have taken a sample pool of the previous nine years, so the data relates to the FA Cup first round since the 2007-08 season.

If we look at the breakdown of the non-league teams in more detail, we can also see that this year there are more teams from level 6 (National League North/South) than usual at the expense of teams from level 5 (The National League). There is one team from level 9 – Westfields FC – of the Midland League Premier Division (level 9).

If we look at the differences between the teams drawn against each other we can see that this year there are only seven ties featuring teams from the same level and the majority of ties feature teams with just one level difference. This could potentially pave the way for an increase in ‘shock’ results this year.

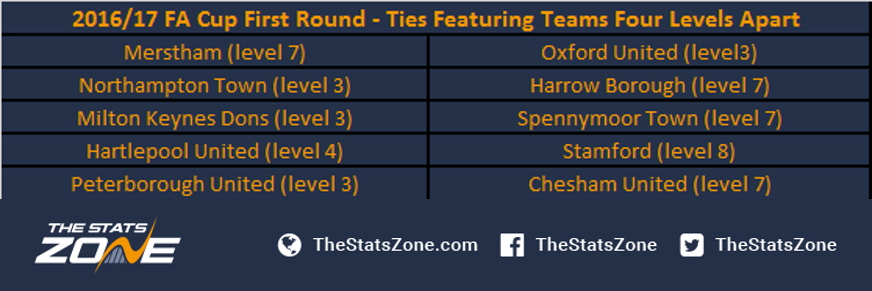
There are five ties featuring teams four levels apart – providing opportunities for the biggest potential giant killings of the round:
Shock Results
The following chart confirms that we can indeed expect more shock results than usual this year. The number of shock results - that is any team progressing at the expense of a team from a higher level - clearly increases as the number of ties featuring teams from the same division decreases and the number of teams with a single level difference increases.

Based on the draw for 2016-17, we predict there will be 13 shock results this year, which is slightly above the average of 10 shock results.
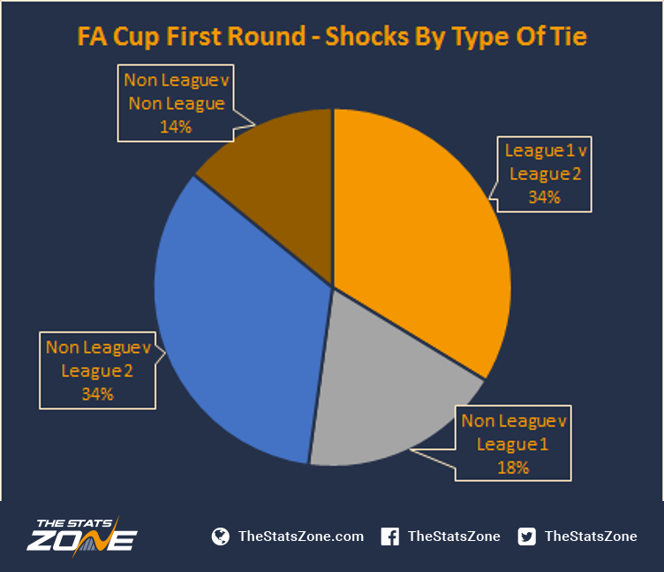
The following pie chart shows the breakdown of the shock results from previous seasons. Of course, we have to take into consideration that there have been more ties featuring teams with only one level difference, but it is clearly the most likely chance of a shock. Perhaps this does not bode well for the four non-league clubs (Merstham, Harrow, Spennymoor and Stamford) looking for a bumper giant killing.

We have also looked at previous shock results by the type of draw; interestingly, the percentage of shocks involving non-league teams beating League Two teams is the same as those involving League Two teams beating League One teams.
Finally, when looking at shock results (any team beating a higher level team) and giant killings (non-league teams beating a league team) we can see that there is an advantage in being drawn at home, although for giant killings it is much less pronounced.

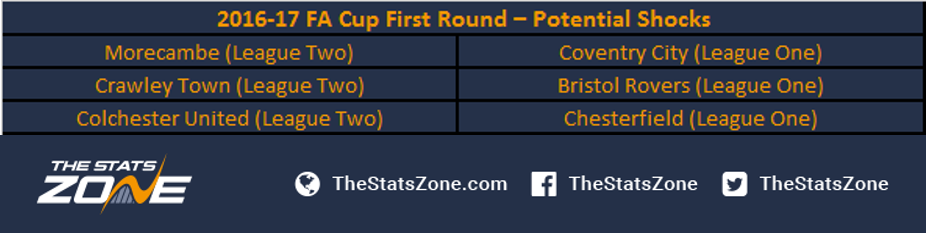
Given the data from these last few charts, the ties to look out for shock results in this year’s draw are:
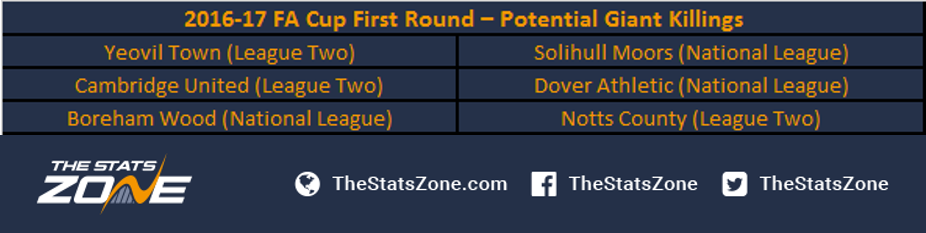
Ties with the best chances of a giant killing are:
Progression
Taking a look at which teams progress into the second round of the FA Cup, we can see that, on average, 28 (59%) of the league teams from round one progress and 12 (37%) of the non-league teams progress.

We can also look at how a home or away draw affects progression for both league and non-league teams:

A little surprisingly, slightly more league clubs who have been drawn away from home have progressed to the second round compared to those drawn at home. For non league teams, it appears there is a distinct advantage to being drawn at home:

A look at the make-up of the non-league teams that manage to progress to the second round shows the majority are unsurprisingly from level 5 (National League) but a few teams from level 6 and below do make it through.

In this year’s draw there are two ties in which both clubs are level 6 or lower:
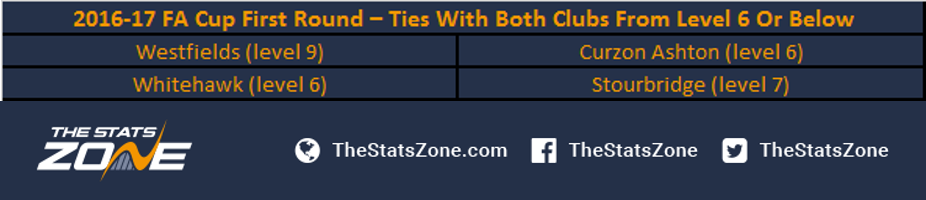
With Westfields being drawn at home against another non-league club, they really do have a chance to become the first team from the ninth tier to progress to the second round.
Replays
Finally, we take a look at the number of ties in recent seasons that have required a replay in order to settle the result. On average, 26% of the ties require a replay, and in 2008-09 40% of the ties went to a replay.

A further look at which ties result in a replay shows that matches involving two teams from League One are most likely to require a replay and, as you might expect, matches involving non-league clubs against League One clubs are least likely to require a replay.

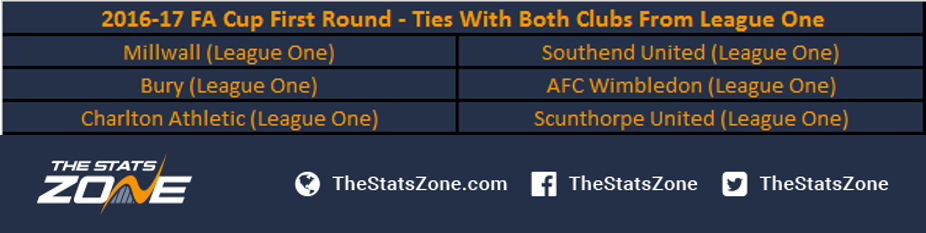
In this years draw, there are three ties involving all League One clubs, so look out for at least one of these to require a replay:
This article uses data from the FA Cup first round draws from the 2007-08 season up to and including the 2016-17 season.


