A Closer Look At Referees In The Premier League
Refereeing in the Premier League has come under a lot of scrutiny recently, mainly on the back of a couple of controversial performances from Mike Dean. Whilst controversial decisions are nothing new, it has appeared that there has been more attention paid than usual to refereeing this season. This could be down to more focus on potential rule changes and the introduction of video technology, but whatever the reason, we want to explore the facts.
To try and look at refereeing in more detail, we’ve collected data back to the start of the 2015/16 season through until the most recent Premier League matches (on the weekend of the 4th February 2017). This has allowed us to analyse each referee’s stats in detail, exploring how many cards and penalties they’ve awarded on average per game, the ratios of awards to either home or away teams plus we see if certain teams benefit more from particular referees.
N.B. For the purpose of this analysis, we’ve only included referees who have officiated 25 or more Premier League games since the start of last season to ensure a sufficient sample size. This means that Stuart Attwell, Keith Stroud, Graham Scott, Paul Tierney and Simon Hooper haven’t had their stats included.
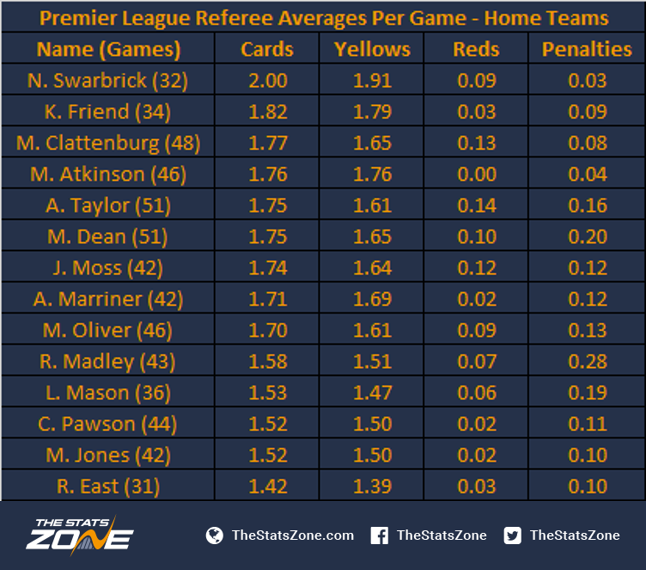
- Neil Swarbrick has been the most card happy to home teams since the start of last season, brandishing an average of 2 cards per game.
- Of those cards, an average of 1.91 have been yellow cards, which is also the highest number awarded to home teams.
- Anthony Taylor has been the referee most eager to brandish a red card to home teams with an average of 0.14 per game, slightly more than Mark Clattenburg (0.13) and Jon Moss (0.12).
- Robert Madley has awarded the most number of penalties on average to home sides, pointing to the spot 0.28 times on average per game.
- Roger East has been the most lenient referee towards home sides in terms of cards, only handing out an average of 1.42 cards per game.
- East has also handed out the fewest yellow cards to home sides on average, with just 1.39 per game.
- Martin Atkinson has incredibly not dished out a red card to a home team in the 46 games in which he has taken charge.
- Despite leading the way with most cards and yellows to home teams, Swarbrick has pointed to the spot on fewer occasions on average than any other referee; he’s awarded a penalty to home teams just 0.03 times per game, slightly less than Atkinson with 0.04.
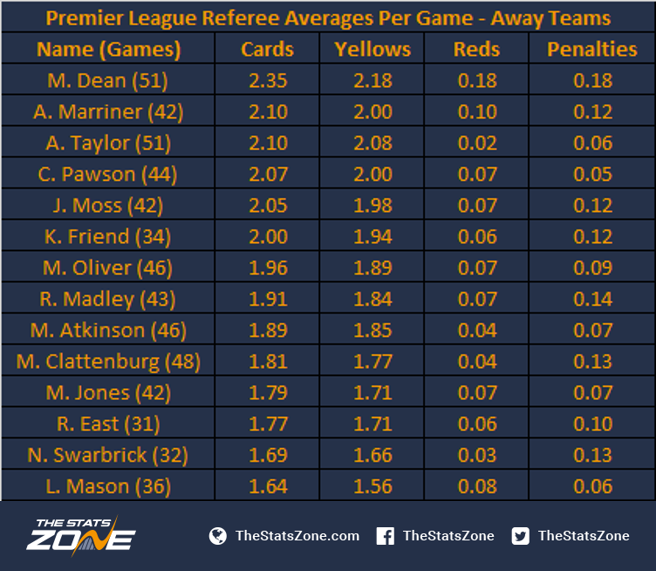
- Mike Dean receives his first mention in the analysis section with him handing out the most cards to away teams with an average of 2.35 per game – a big difference of 0.25 per game more than second-placed Andre Marriner.
- Following a similar theme to the home teams, Dean has also handed out the most yellow cards, with an average of 2.18 per game.
- Perhaps unsurprisingly, Dean has also dished out the most red cards to away teams per game, with an average of 0.18.
- Dean completes the clean sweep as he has pointed to the spot more times for away teams than any other referee - an average of 0.18 times per game.
- Lee Mason has been the kindest referee to away sides, showing just 1.64 cards on average per game.
- Following the trends we’ve seen previously, Mason has handed out the fewest amount of yellows to away teams with just 1.56 per game on average.
- Despite showing the most red cards to home teams, Taylor has shown the fewest number of red cards on average to away teams with just 0.02 per game, which equates to just one of the eight red cards he has brandished.
- Craig Pawson has pointed to the spot for away sides fewer than any other referee, with 0.05 on average per game.
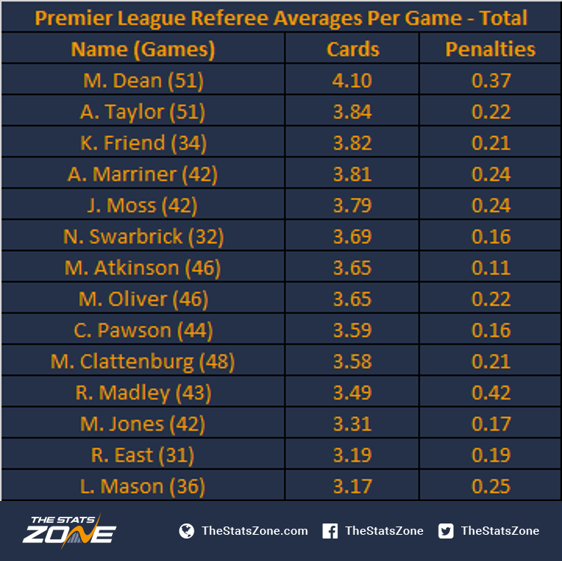
- When we combine the numbers to see what referees have done overall on average per game since the start of the 2015/16 season, Dean comes out on top with the most cards shown with an average of 4.10 per game.
- Dean almost came out on top for most penalties awarded on average too, but he ended up second behind Madley with 0.37 penalties awarded on average per game, with Madley pointing to the spot 0.42 times on average per game. They are the only two officials who have awarded a penalty, on average, more than once every three games since the beginning of the 2015/16 season.
- Mason has dished out fewer cards on average than any other with 3.17 per game.
- If Atkinson is refereeing a game you’re watching soon, it’s best not to expect a penalty to be awarded as the whistler has pointed to the spot just five times in 46 games (0.11 times on average per game).
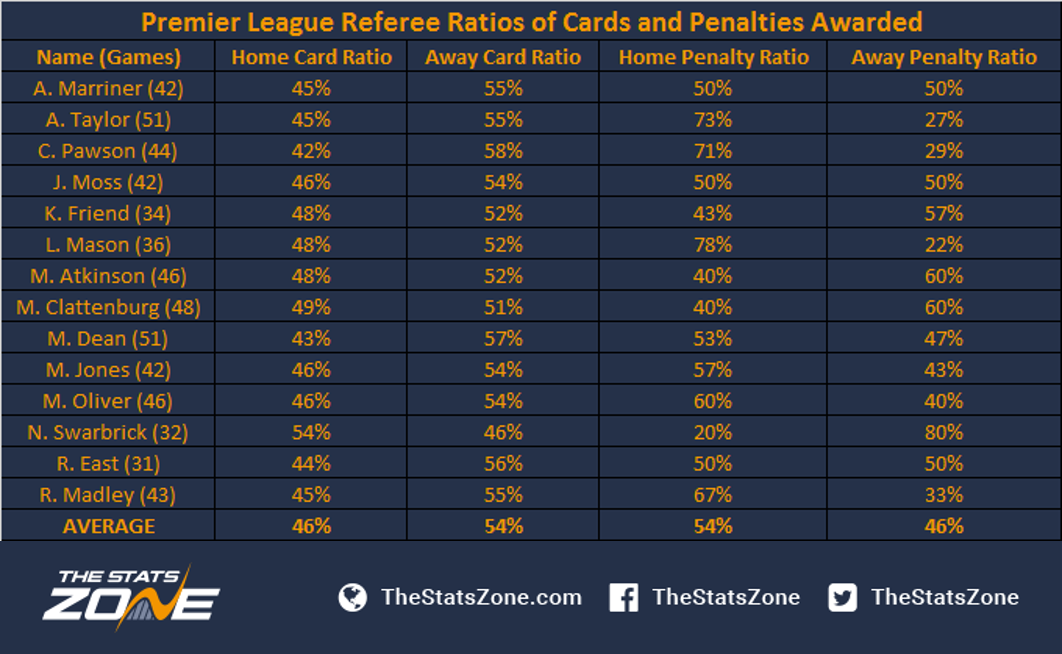
A common saying amongst football fans is that the referee is a ‘homer’, suggesting they are swayed by the home crowd. The table above shows the home and away ratios for each referee for cards shown and penalties awarded since the beginning of the 2015/16 campaign.
- The numbers for cards shown are fairly consistent across the board but there are a couple of exceptions. Pawson (58%), Dean (57%) and East (56%) have tended to show more cards to away sides than home.
- On the other side of the coin, 54% of Swarbrick’s cards have been awarded to the home side.
- The penalty ratios show much larger discrepancies. 80% of Swarbrick’s penalties have been awarded to the visiting team (although this is from a sample of just five penalties awarded). This tendency falls into place with Swarbrick handing out more cards on average to home teams than any other referee.
- 78% of Mason’s penalties have gone to the home team, which is quite surprising considering he has handed out the fewest cards on average to away sides.
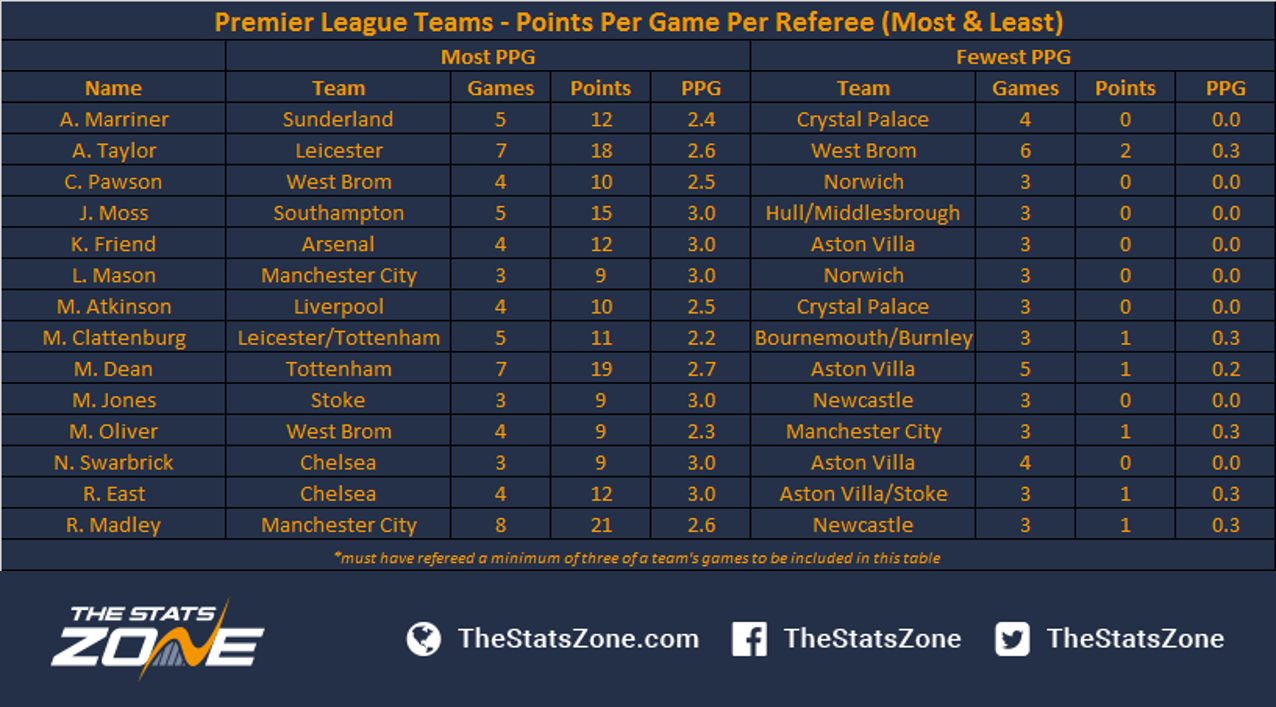
The above table shows the teams who have enjoyed the best ratio of points when each referee has taken charge of their games, as well as the teams who have suffered the worst results too.
- In the last two seasons, Southampton (Moss), Arsenal (Friend), Manchester City (Mason), Stoke (Jones) and Chelsea (Swarbrick and East) have 100% records when those referees have taken charge of their games.
- On the flip side, Crystal Palace (Marriner and Atkinson), Norwich (Pawson and Mason), Hull (Moss), Middlesbrough (Moss), Aston Villa (Friend and Swarbrick) and Newcastle (Jones) have all gone without a single point in the games that those referees have officiated.
- Man City’s 21 points collected from games refereed by Madley is the most by any side during this period.
- Crystal Palace’s inability to pick up any points from four games refereed by Andre Marriner is the joint worst record alongside Aston Villa under Swarbrick.
Perhaps some of the criticism of Mike Dean was justified, with travelling fans arguably the most vocal at most Premier League grounds. They seem to have been getting a raw deal from the man in the middle with his theatrics also not aiding his cause. Despite the high numbers, he could also be justified in the amount of times he’s pointed to the spot or shown a card as they may be completely warranted. It isn’t just Dean who has come under pressure recently but when looking at some of the figures above – those of Swarbrick for example - it will be intriguing to pay close attention to the decisions the Premier League referees make from now on to see how future decisions would alter their numbers.
If a referee is card-shy or awarding fewer penalties, does that make them a better referee? Are the referees who haven’t been mentioned much, if at all, in the above analysis the better referees? The numbers can be viewed in many different ways and we will keep tabs on these trends as the sample size grows.
In terms of our final table, some fans may choose to read what they will into those statistics, but it’s important to bear in mind these results could be purely circumstantial at this stage.


